Market Analysis Template PPT and Google Slides Themes

Market analysis PowerPoint slide featuring a pie chart with labeled segments and captions for each market category.
P.ID : 34822
    319 views
    16 Downloads
    Get Custom Slides by Experts
    Instantly Access Templates in PowerPoint

    Market Analysis Template PowerPoint


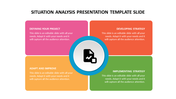
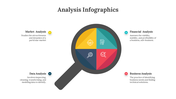
    Commence your analysis-based presentations for your company by introducing our Market Analysis Template PowerPoint. The slide is designed to empower your presentations with comprehensive market insights. It has a circular pie chart divided into four sections. Each of them is accompanied by precise percentage values. Ample space is allocated to articulate a detailed description of each segment. 

    Suitable for marketing professionals, business analysts and strategic planners. An ideal template for market trends, analyzing competitors or emphasizing key market drivers. Download now, if want to ensure your audience gets to know the intricacies of your market assessment.

    Features of the template

    • The slide contains 16:9 and 4:3 formats.
    • Compatible with Google slide themes and PowerPoint.
    • 100% customizable slides and easy to download.
    • It is easy to change the colors of the slide quickly.
    • Well-crafted template with an instant download facility.
    Advertisement

    You May Also Like These PowerPoint Templates

    Free
    Add to Wishlist
    Download
    AI Customize
    Colorful radial design with six segments around a red analysis icon, highlighting key analytics strategies.
    Add to Wishlist
    Download
    AI Customize
    Five colorful oval shapes in blue, green, red, orange, and teal, with shadow effects, featuring icons and captions inside.
    Add to Wishlist
    Download
    AI Customize
    Side-by-side Pareto analysis blocks with 20% and 80% sections, representing complaints and reasons in contrasting colors.
    Add to Wishlist
    Download
    AI Customize
    Capabilities analysis template featuring color coded categories on the left and a circular percentage chart on the right.
    Add to Wishlist
    Download
    AI Customize
    Circular diagram with four segments in yellow, green, blue, and teal, each containing icons around a white central circle.
    Add to Wishlist
    Download
    AI Customize
    Use Performance PowerPoint And Google Slides Template
    Add to Wishlist
    Download
    AI Customize
    Illustration of a woman analyzing colorful bar and pie charts, with three color coded circular icons on the right.
    Add to Wishlist
    Download
    AI Customize
    Five numbered interconnected puzzle pieces in red, green, purple, teal, and blue, with human illustrations above.
    Add to Wishlist
    Download
    AI Customize
    Vibrant PESTLE chart dividing political, economic, social, technological, legal, and environmental aspects.
    Add to Wishlist
    Download
    AI Customize
    Analysis template with a man looking through a magnifying glass at a computer screen with four types and caption areas.
    Add to Wishlist
    Download
    AI Customize
    Step-by-step analysis diagram with a central focus on analysis, flanked by six green-highlighted steps.
    Add to Wishlist
    Download
    AI Customize
    Molecular-style infographic with interconnected colored nodes linked to six labeled captions for analysis ideas.
    Add to Wishlist
    Download
    AI Customize
    Central hexagonal shape with multicolor triangles around and two text areas with bar chart and coin stack with percentages.
    Add to Wishlist
    Download
    AI Customize
    Business Analytics slide featuring three stages with icons representing question, insight, and growth.
    Add to Wishlist
    Download
    AI Customize
    Illustration of a person analyzing charts in blue accents, with four analysis types listed on the right.
    Add to Wishlist
    Download
    AI Customize
    Four colorful vertical banners in yellow, red, blue, and green with icons, title, and descriptions for web analytics uses.
    Add to Wishlist
    Download
    AI Customize
    Data analysis featuring icons for data interpretation, market research, and performance evaluation.
    Free
    Add to Wishlist
    Download
    AI Customize
    Amazing Business Analytics PPT Templates and Google Slides
    Add to Wishlist
    Download
    AI Customize
     slide featuring three circular charts for data analysis, followed by a line chart displaying monthly trends.