Best Performance PowerPoint And Google Slides Template


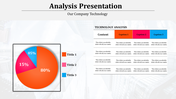

PPT Slide for Performance Data
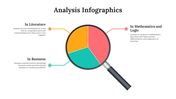
Earn your audience's trust with this PPT Slide for Performance Data. It features a performance epitome of sales and employees. Also, abstracts the details of the method, including charges, progress plans, and so on. Show it off to senior managers, who can then refer back to it when discussing performance matters. The three nodes are added with the tabular column, which drafts a precise data display. With quick customization, you can leisurely frame your PPTs. It's time to frame the performance chart! Go ahead and hit up the victory!
Features of the template:
- 100% customizable slides and easy to download.
- Slides are available in different nodes & colors.
- The slide contained 16:9 and 4:3 formats.
- Easy to change the slide colors quickly.
- Well-crafted template with an instant download facility.
- Tabular column included.


You May Also Like These PowerPoint Templates
Add to Wishlist
Download
Edit


Add to Wishlist
Download
Edit


Free
Add to Wishlist
Download
Edit


Add to Wishlist
Download
Edit

Add to Wishlist
Download
Edit

Add to Wishlist
Download
Edit

Add to Wishlist
Download
Edit

Add to Wishlist
Download
Edit

Add to Wishlist
Download
Edit

Add to Wishlist
Download
Edit

Add to Wishlist
Download
Edit

Add to Wishlist
Download
Edit

Add to Wishlist
Download
Edit

Add to Wishlist
Download
Edit

Add to Wishlist
Download
Edit

Add to Wishlist
Download
Edit
