Free - Editable Analysis PPT Presentation Template for Insights

Free
Analysis presentation template with six sections arranged in a blue circle, each featuring an icon and caption.
P.ID : 36813
    325 views
    168 Downloads
    Get Custom Slides by Experts
    Instantly Access Templates in PowerPoint

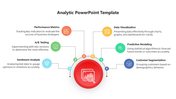
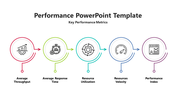
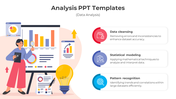
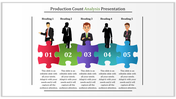
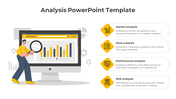
    Data Insights with Our Dynamic Analysis PowerPoint Template and Google Slides Themes

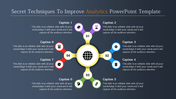
    Unlock the potential of your presentations with our cutting-edge, free Analysis PowerPoint template. Featuring six interconnected nodes in a sleek circular loop design, each arrow guides your audience seamlessly through your data story. With customizable captions, title holders, and text areas, convey complex analyses effortlessly. The subdued white background ensures focus on your content. Target users, from business analysts to educators, will find this template invaluable for conveying insights persuasively. Our unique selling proposition lies in the seamless integration of form and function, empowering users to craft impactful presentations with ease. Say goodbye to outdated slides and embrace the future of data communication. Elevate your presentations with our Analysis PowerPoint template today.

    Features of the Template

    • 100 % customizable slides.
    • The slide show is in 4:3, 16:9, zip format.
    • There is powerful connectivity with Google Slides and PowerPoint.
    • It is simple and quick to alter the slide's color.
    • An efficient template that can be easily accessed immediately.
    • Well-crafted template with an instant download facility
    Advertisement

    You May Also Like These PowerPoint Templates

    Add to Wishlist
    Download
    AI Customize
    Step-by-step analysis diagram with a central focus on analysis, flanked by six green-highlighted steps.
    Add to Wishlist
    Download
    AI Customize
    Molecular-style infographic with interconnected colored nodes linked to six labeled captions for analysis ideas.
    Add to Wishlist
    Download
    AI Customize
    Central hexagonal shape with multicolor triangles around and two text areas with bar chart and coin stack with percentages.
    Add to Wishlist
    Download
    AI Customize
    Business Analytics slide featuring three stages with icons representing question, insight, and growth.
    Add to Wishlist
    Download
    AI Customize
    Data analysis template with a bar graph and illustrated dashboard layout with two caption areas for data.
    Add to Wishlist
    Download
    AI Customize
    Illustration of a person analyzing charts in blue accents, with four analysis types listed on the right.
    Add to Wishlist
    Download
    AI Customize
    Four colorful vertical banners in yellow, red, blue, and green with icons, title, and descriptions for web analytics uses.
    Add to Wishlist
    Download
    AI Customize
    Data analysis featuring icons for data interpretation, market research, and performance evaluation.
    Free
    Add to Wishlist
    Download
    AI Customize
    Amazing Business Analytics PPT Templates and Google Slides
    Add to Wishlist
    Download
    AI Customize
     slide featuring three circular charts for data analysis, followed by a line chart displaying monthly trends.
    Add to Wishlist
    Download
    AI Customize
    Banking data analysis slide with green bar chart on a computer screen and three listed issues in circles on the right.
    Add to Wishlist
    Download
    AI Customize
    Data analysis slide with a monitor showing analytics icons, and five colorful speech bubbles indicating various steps around it.
    Add to Wishlist
    Download
    AI Customize
    Four blue pin markers with circular bases in a zigzag pattern, each labeled with percentages and descriptive captions.
    Add to Wishlist
    Download
    AI Customize
    Slide with an orange upright and a purple inverted triangle, each featuring icons and four numbered captions around them.
    Add to Wishlist
    Download
    AI Customize
    Analysis slide featuring a magnifying glass over banana, with three circular progress charts in green, orange, and yellow.
    Add to Wishlist
    Download
    AI Customize
    Four staggered colored bars in blue, green, yellow, and purple with icons and captions aligned horizontally.
    Add to Wishlist
    Download
    AI Customize
    Stakeholder analysis slide showing a group of professionals discussing laptops in a meeting room.
    Add to Wishlist
    Download
    AI Customize
    Central speedometer icon with curved black line and five connected colored circles linking labeled sections.