Creative Pareto Analysis Template Presentation Slide

Side-by-side Pareto analysis blocks with 20% and 80% sections, representing complaints and reasons in contrasting colors.
P.ID : 50852
    124 views
    9 Downloads
    Get Custom Slides by Experts
    Instantly Access Templates in PowerPoint

    80/20  Rule PowerPoint Slide

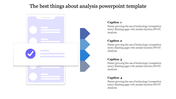
    Now you can present your results quickly in a presentation. Yes! We SlideEgg offers various chart slides using which you can screen your results digitally. Here Pareto analysis chart presentation is available, and we designed it as per user needs. Pareto analysis is the formal technique of analyzing the problems and root causes. Eighty percent of problems are always created by 20 percent of causes. It helps to identify and focus on areas with process improvement. This slide has two squares and arrows. Dual colors are used here, and the squares are parted to show distinct reasons and complaints. The text area is given on both sides, making it easy to add your texts neatly. It will help you make unique presentations and share your analyzed results in an interesting way. Download Now!!!

    Features of the template

    • 100% customizable slides and easy to download.
    • Slides are available in different nodes & colors.
    • The slide contains 16:9 and 4:3 formats.
    • Easy to change the colors of the slide quickly.
    • Well-crafted template with instant download facility.
    • Dual colors on a white background look classic.
    Advertisement

    You May Also Like These PowerPoint Templates

    Add to Wishlist
    Download
    AI Customize
    Situation analysis PPT slide featuring icons for industry research and firm capabilities with captions in two colored boxes.
    Add to Wishlist
    Download
    AI Customize
    Bar graph in multiple colors showing evolution over years, with a human figure and three text boxes on the right.
    Add to Wishlist
    Download
    AI Customize
    Innovative Current Situation PowerPoint And Google Slides
    Add to Wishlist
    Download
    AI Customize
    Best Target Operation Model PowerPoint Presentation
    Add to Wishlist
    Download
    AI Customize
    Pack of slides with colorful icons and sections for various data analysis, including visuals and layouts.
    Free
    Add to Wishlist
    Download
    AI Customize
    Analysis PowerPoint slide featuring a bar graph and vehicle icons with placeholders for text and subheadings.
    Free
    Add to Wishlist
    Download
    AI Customize
    Analysis slide with six segmented circular progress charts in gray and orange, each linked by gray bars and labeled below.
    Free
    Add to Wishlist
    Download
    AI Customize
    Analysis PowerPoint slide showcasing a target with an arrow, a chart, and a message box with caption text.
    Add to Wishlist
    Download
    AI Customize
    Performance slide with four quadrants in red, green, teal, and blue, connected in a circular flow with relevant text.
    Free
    Add to Wishlist
    Download
    AI Customize
    Grayscale process flow diagram with three horizontal arrows, numbered 01 to 03, showing analysis steps.
    Free
    Add to Wishlist
    Download
    AI Customize
    Green concentric circles with the word why in the center, connected to six captions on a light gray background.
    Free
    Add to Wishlist
    Download
    AI Customize
    Creative word cloud in a circular layout highlighting key terms such as statistical, business, and analysis.
    Free
    Add to Wishlist
    Download
    AI Customize
    Free Slide Layouts PowerPoint Template For Business
    Add to Wishlist
    Download
    AI Customize
    Slide with a marketing competitor analysis template showing a 2x2 matrix with colored bubbles labeled A to D.
    Free
    Add to Wishlist
    Download
    AI Customize
    Dark background slide featuring a yellow, green, red, and blue pinwheel shape surrounded by captions with percentages.
    Free
    Add to Wishlist
    Download
    AI Customize
    Analysis presentation template with six sections arranged in an orange circle, each featuring an icon and caption.
    Add to Wishlist
    Download
    AI Customize
    Colorful infographic PPT slide illustrating five types of analysis literary, market, data, financial, and business analysis.
    Free
    Add to Wishlist
    Download
    AI Customize
    Marketing analysis PowerPoint template featuring a chart on an easel and four captions with visuals.
    Add to Wishlist
    Download
    AI Customize
    Slide for production counts analysis with a line graph showing quantity scores over multiple sessions and data indicators.
    Free
    Add to Wishlist
    Download
    AI Customize
    Business analytics template with four orange tilted panels, each featuring an icon, caption, and description.