Break Even Analysis PPT And Google Slides Templates

Pack of 13 slides
P.ID : 50094
Advertisement
238 views
45 Downloads
Get Custom Slides by Experts
Instantly Access Templates in PowerPoint

Break Even Analysis Presentation Slide

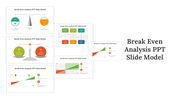
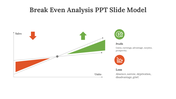
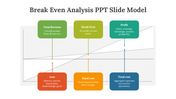
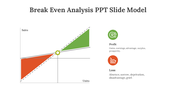
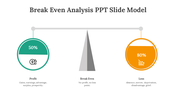
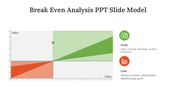
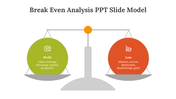
Break even analysis is a financial tool that helps businesses determine the point at which total revenue equals total costs, resulting in neither profit nor loss. It enables companies to understand the minimum level of sales required to cover all expenses. By analyzing fixed costs, variable costs, and selling price, businesses can make informed decisions about pricing, production volume, and profitability. Our presentation template on Break-even Analysis provides a comprehensive framework to showcase this analysis, with clear visuals, charts, and customizable sections. Optimize your decision-making and financial planning with our powerful template.

Features of the templates:

  • 100% customizable slides and easy to download.
  • Slides are available in different nodes & colors.
  • The slide contained 16:9 and 4:3 formats.
  • Easy to change the slide colors quickly.
  • It is a well-crafted template with an instant download facility.
  • Highly compatible with PowerPoint and Google Slides.

You May Also Like These PowerPoint Templates

Add to Wishlist
Download
AI Customize
Creative Business Analytics PowerPoint For Presentation
Add to Wishlist
Download
AI Customize
Six pie analysis charts in blue, red, orange, green, teal, and purple, displaying percentages from 15% to 90%.
Add to Wishlist
Download
AI Customize
Linear timeline showing red triangular nodes connected by dots, each node containing an icon and caption.
Add to Wishlist
Download
AI Customize
Attractive Business Analytics PowerPoint Template Design
Add to Wishlist
Download
AI Customize
Business analysis slide with a central pink gradient circle surrounded by  six colorful icons with text, on a gray backdrop.
Add to Wishlist
Download
AI Customize
A person working on a laptop with analysis data, alongside bar charts with percentage and text box, on a gray background.
Add to Wishlist
Download
AI Customize
Colorful SOAR Model PowerPoint slide with circles and icons with strength, opportunities, aspirations, and results.
Add to Wishlist
Download
AI Customize
Analytics slide with line graph, pie chart, and statistics showing 13M views, 13M active subscribers, and 991K subscribers.
Add to Wishlist
Download
AI Customize
Financial slide with golden globes for two countries, featuring coin stacks next to one, with blue percentage bars below.
Add to Wishlist
Download
AI Customize
Performance PPT And Google Slides Themes For Your Needs
Add to Wishlist
Download
AI Customize
Market analysis PowerPoint slide featuring a pie chart with labeled segments and captions for each market category.
Add to Wishlist
Download
AI Customize
Analysis presentation slide showing a technology growth chart with percentage values and icons with placeholder text.
Free
Add to Wishlist
Download
AI Customize
Best Scenario Analysis Presentation Template Slides
Add to Wishlist
Download
AI Customize
Buy Affordable Data Analysis Presentation Template
Add to Wishlist
Download
AI Customize
Customize Feasibility Study PPT And Google Slides Themes
Add to Wishlist
Download
AI Customize
Analysis PPT slide with four colorful text boxes and unique icons for each stage of the process with captions.
Add to Wishlist
Download
AI Customize
Yellow pie chart divided into Analysis 1, 2, and 3 segments, focused by a black magnifying glass icon.
Add to Wishlist
Download
AI Customize
Graph with three numbered curves in green, orange, and red, with corresponding text on the right.
Free
Add to Wishlist
Download
AI Customize
Blue themed slide with two square icons on tilted diamonds and two rectangular caption boxes on the right.
Free
Add to Wishlist
Download
AI Customize
Analysis PPT slide showing a phone with a checklist and icons with multiple captions with text descriptions.
Add to Wishlist
Download
AI Customize
Business analytics layout with a central rocket graphic surrounded by cloud shaped icons for five sequential steps.
Free
Add to Wishlist
Download
AI Customize
Circular analysis diagram featuring six purple sections with icons like a target and gear, arranged around a black bar chart.
Free
Add to Wishlist
Download
AI Customize
Four triangular icons in yellow, pink, purple, and red, showing percentages, with gray caption boxes below.
Add to Wishlist
Download
AI Customize
Slide featuring a five step process for performance with matching icons for each phase.
Free
Add to Wishlist
Download
AI Customize
Analysis presentation template with six sections arranged in a yellow circle, each featuring an icon and caption.
Add to Wishlist
Download
AI Customize
Analysis PowerPoint slide featuring a hexagonal internal analysis core and six colorful surrounding icons with labels.
Add to Wishlist
Download
AI Customize
Colorful pie chart with a man holding a pencil, surrounded by directional arrows, symbolizing analysis and decision making.
Free
Add to Wishlist
Download
AI Customize
Business analysis slide featuring profile cards in blue and white, with four icons and captions on the right.
Add to Wishlist
Download
AI Customize
Slide deck featuring multiple analysis templates with colorful layouts, charts, and icons for data representation.
Add to Wishlist
Download
AI Customize
Performance template with four linked circles labeled from finance to business processes, each with bullet points and icons.
Add to Wishlist
Download
AI Customize
Colorful circular analysis template featuring six sections with icons growth, target, people, settings, data, and analytics.