Sterling Break Even Analysis PowerPoint Slide presentation


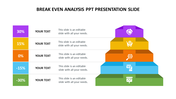
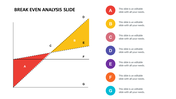
Six-Noded Break-Even Analysis Slide
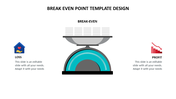
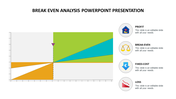
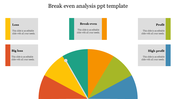
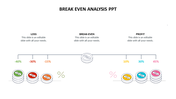
Break-even analysis helps to determine the profitable point of your business, new product, or service. It can help investors to decide the point at which they will recoup their investment. Present your financial calculation to determine your break-even point with our colorful break-even analysis PowerPoint slide. It is a six-noded slide with a graph and six multicolor boxes to present the total revenue, break-even, profit, loss, fixed cost, and total cost. The simple white background helps to beautifully show the colorful graphics. It is easy to edit for your needs. Download it to break the mould!
Features of the template
- 100% customizable slides and easy to download.
- Slides are available in different nodes & colors.
- The slide contains 16:9 and 4:3 formats.
- Easy to change the colors of the slide quickly.
- Well-crafted template with an instant download facility.
- Colorful analysis PPT slide.


You May Also Like These PowerPoint Templates
Add to Wishlist
Download
Edit

Add to Wishlist
Download
Edit

Add to Wishlist
Download
Edit

Add to Wishlist
Download
Edit

Add to Wishlist
Download
Edit


Add to Wishlist
Download
Edit


Add to Wishlist
Download
Edit

Add to Wishlist
Download
Edit

Add to Wishlist
Download
Edit

Add to Wishlist
Download
Edit

Add to Wishlist
Download
Edit


Add to Wishlist
Download
Edit

Add to Wishlist
Download
Edit

Add to Wishlist
Download
Edit

Add to Wishlist
Download
Edit

Add to Wishlist
Download
Edit
