Free - Free Break Even Analysis PowerPoint Slide zig-zag Model
Free


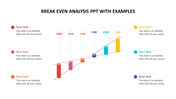

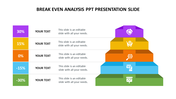
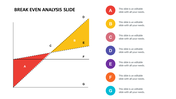
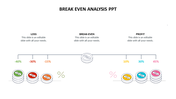
Best Break Even Analysis PPT Template
Create analysis presentations with our Best Break Even Analysis PPT Template. This is a well-designed template with a professional touch. This is a 100% user-friendly template. This is one of the best Break-even Analysis templates from SlideEgg.
This is a five nodded template. The five nodes are horizontally arranged in a zig-zag manner at the center of this template. They are contrasted with the vibrant shades of red, pink, indigo, blue, and yellow. Use this break-even analysis template to let your audience get your analysis quickly. Grab now!!!
Features of the template:
- 100% customizable slides and easy to download.
- Slides are available in different nodes & colors.
- The slide contained 16:9 and 4:3 formats.
- Easy to change the slide colors quickly.
- Well-crafted template with instant download facility.
- Fantastic five-node featured template.
- Premium template with vibrant outlook.


You May Also Like These PowerPoint Templates
Add to Wishlist
Download
AI Customize

Add to Wishlist
Download
AI Customize

Add to Wishlist
Download
AI Customize

Add to Wishlist
Download
AI Customize

Add to Wishlist
Download
AI Customize


Add to Wishlist
Download
AI Customize


Add to Wishlist
Download
AI Customize

Add to Wishlist
Download
AI Customize

Add to Wishlist
Download
AI Customize

Add to Wishlist
Download
AI Customize

Add to Wishlist
Download
AI Customize


Add to Wishlist
Download
AI Customize

Add to Wishlist
Download
AI Customize

Add to Wishlist
Download
AI Customize

Add to Wishlist
Download
AI Customize

Add to Wishlist
Download
AI Customize
