Innovative Break even Analysis PPT With Examples Template

Color-coded break-even analysis with bars from 10M to 30M along a rising dotted line and text areas for values.
P.ID : 50052
    11 slides
    Customize Feasibility Study PPT And Google Slides Themes
    16 slides
    Slide deck with coloful infographics and diagrams explaining target market analysis, segments, and customer base analysis.
    13 slides
    Slide deck featuring multiple analysis templates with colorful layouts, charts, and icons for data representation.
    422 views
    55 Downloads
    Get Custom Slides by Experts
    Instantly Access Templates in PowerPoint

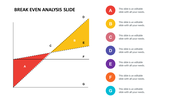
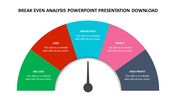
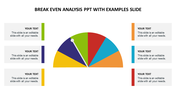
    Break-Even Analysis Presentation Slide

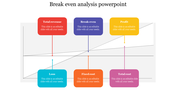
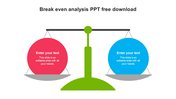
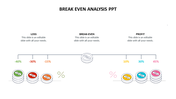
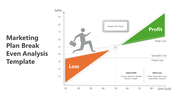
    Are you tired of guessing when your business will start making a profit? Introducing the Break Even Analysis, a powerful tool that helps you determine the exact point where your total revenue equals your total expenses. With this template, you can easily create a visually appealing and comprehensive presentation that will impress your investors and stakeholders. Start making informed decisions for your business today.

    Features of the template:

    • 100% customizable slide and easy to download.
    • Easy to change the slide's colors.
    • The template contains 16:9 and 4:3 formats.
    • Highly compatible with PowerPoint and Google Slides.
    • This slide has a colorful design pattern.
    Advertisement

    You May Also Like These PowerPoint Templates

    Add to Wishlist
    Download
    AI Customize
    Performance template with four linked circles labeled from finance to business processes, each with bullet points and icons.
    Add to Wishlist
    Download
    AI Customize
    Colorful circular analysis template featuring six sections with icons growth, target, people, settings, data, and analytics.
    Add to Wishlist
    Download
    AI Customize
    Blue infographic with location pins displaying percentages for market analysis, arranged in a triangular layout.
    Add to Wishlist
    Download
    AI Customize
    Business growth analysis slide featuring a cartoon character with a telescope showing a bar chart, and four captions.
    Add to Wishlist
    Download
    AI Customize
    Situation analysis PPT slide featuring icons for industry research and firm capabilities with captions in two colored boxes.
    Add to Wishlist
    Download
    AI Customize
    Bar graph in multiple colors showing evolution over years, with a human figure and three text boxes on the right.
    Add to Wishlist
    Download
    AI Customize
    Market analysis slide featuring a multi-colored circular chart with percentage labels and text captions on each side.
    Add to Wishlist
    Download
    AI Customize
    Innovative Current Situation PowerPoint And Google Slides
    Add to Wishlist
    Download
    AI Customize
    Best Target Operation Model PowerPoint Presentation
    Free
    Add to Wishlist
    Download
    AI Customize
    Yellow themed market analysis infographic with five numbered steps, icons, and text boxes arranged in a zigzag pattern.
    Add to Wishlist
    Download
    AI Customize
    Pack of slides with colorful icons and sections for various data analysis, including visuals and layouts.
    Free
    Add to Wishlist
    Download
    AI Customize
    Analysis PowerPoint slide featuring a bar graph and vehicle icons with placeholders for text and subheadings.
    Free
    Add to Wishlist
    Download
    AI Customize
    Analysis slide with six segmented circular progress charts in gray and orange, each linked by gray bars and labeled below.
    Free
    Add to Wishlist
    Download
    AI Customize
    Analysis PowerPoint slide showcasing a target with an arrow, a chart, and a message box with caption text.
    Add to Wishlist
    Download
    AI Customize
    Slide with a quarterly timeline chart displaying tasks in green and blue bars, organized by weekdays and quarters.
    Add to Wishlist
    Download
    AI Customize
    Performance slide with four quadrants in red, green, teal, and blue, connected in a circular flow with relevant text.
    Free
    Add to Wishlist
    Download
    AI Customize
    Grayscale process flow diagram with three horizontal arrows, numbered 01 to 03, showing analysis steps.
    Free
    Add to Wishlist
    Download
    AI Customize
    Best Market Analysis PPT Template & Google Slides Themes
    Free
    Add to Wishlist
    Download
    AI Customize
    Creative word cloud in a circular layout highlighting key terms such as statistical, business, and analysis.