Break Even Analysis Presentation And Google Slides Template

 Canva
Canva
Break Even Analysis PowerPoint, Google Slides, and Canva Template
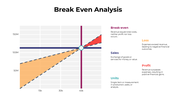
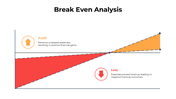
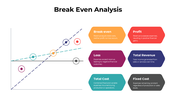
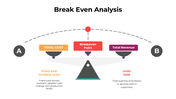
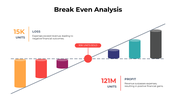
Break-even analysis is a fundamental financial tool used to determine the point at which total costs equal total revenue. This calculation helps businesses understand the minimum sales required to avoid losses and evaluate profitability. It’s a critical decision-making process for pricing, cost management, and financial planning.
Purpose Of The Slides
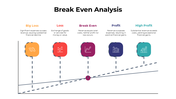
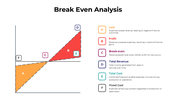
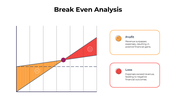
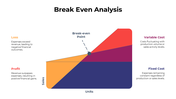
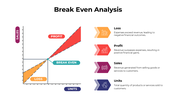
This slide is designed to break down the concept of break-even analysis into clear, actionable insights. It highlights essential components like fixed costs, variable costs, and contribution margins, offering a detailed view of how they impact financial stability. The slide ensures professionals and students can quickly grasp the process of identifying break-even points and leverage this knowledge to optimize business strategies.
Who Can Use It?
Ideal for business owners, financial analysts, MBA students, and anyone involved in budgeting or forecasting, this presentation template is a valuable asset. It is especially useful for those seeking to present financial data visually or understand how to adjust cost structures for better outcomes.
Special Key Features
A vibrant 16-slide deck featuring a multicolor theme, editable text, and customizable infographics. Covers key elements of break-even analysis, including cost components, profitability zones, and financial insights, ensuring an engaging presentation experience.Unlock the potential of break-even analysis with this expert-designed template. Perfect for crafting impactful presentations and simplifying complex financial data.
Features of this template
- 100% customizable slides and easy to download.
- The slides contain 16:9 and 4:3 formats.
- Easy to change the colors quickly.
- Highly compatible with PowerPoint, Google Slides, and Canva templates.


You May Also Like These PowerPoint Templates


Showing36 of69,218 templates