Competitor Analysis Google Slides & PowerPoint Presentation

Concentric analysis circular chart with segmented arcs in orange, red, blue, and green, labeled 20% to 80%.
P.ID : 12641
    1.5K+ views
    80 Downloads
    Get Custom Slides by Experts
    Instantly Access Templates in PowerPoint

    Multi-Color Analysis PowerPoint Templates Slide

    Download this Competitor Analysis PPT Template Free Slide from SlideEgg to effectively present your business analysis report. It is specially designed to accelerate your business function and reach the set targets. This unique slide helps you to create highly professional-looking presentations without any technical skills. In addition, you can use this template in corporate meetings and seminars to visualize your business analysis to improve your strategies.

    About the template:

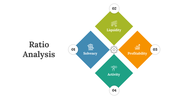
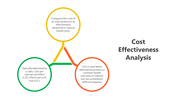
    The Competitor Analysis PPT Template Free Download has creative, multi-color concentric circle model infographics. Each circle has a percentage value at the end to represent your findings. In addition, it has four text boxes on the right side of the slide where you place your information in an easily understandable way. It is a perfect choice for presenting your findings. It will help you to improve your business strategies to gain more profits for your organizations.

    The Competitor Analysis PPT Template Free Download has eye-catching visuals to captivate your audience's attention. It is a fully editable template that allows you to modify the text formats, color schemes, nodes, background, etc. You can easily communicate the overview of your business performance with the help of this analysis PowerPoint template. Download this eye-catching slide right now!

    Features of this template:

    1. 100 % customizable slides and easy to download.
    2. Slides available in different nodes & colors.
    3. The slide contained 16:9 and 4:3 format.
    4. Easy to change the slide colors quickly.
    5. Well-crafted template with instant download facility.
    6. Eye-catching template for presenting your findings.
    7. Attractive visuals will captivate your audience's attention.
    Advertisement

    You May Also Like These PowerPoint Templates

    Add to Wishlist
    Download
    AI Customize
    Molecular-style infographic with interconnected colored nodes linked to six labeled captions for analysis ideas.
    Add to Wishlist
    Download
    AI Customize
    Central hexagonal shape with multicolor triangles around and two text areas with bar chart and coin stack with percentages.
    Add to Wishlist
    Download
    AI Customize
    Business Analytics slide featuring three stages with icons representing question, insight, and growth.
    Add to Wishlist
    Download
    AI Customize
    Illustration of a person analyzing charts in blue accents, with four analysis types listed on the right.
    Add to Wishlist
    Download
    AI Customize
    Four colorful vertical banners in yellow, red, blue, and green with icons, title, and descriptions for web analytics uses.
    Add to Wishlist
    Download
    AI Customize
    Data analysis featuring icons for data interpretation, market research, and performance evaluation.
    Free
    Add to Wishlist
    Download
    AI Customize
    Amazing Business Analytics PPT Templates and Google Slides
    Add to Wishlist
    Download
    AI Customize
     slide featuring three circular charts for data analysis, followed by a line chart displaying monthly trends.
    Add to Wishlist
    Download
    AI Customize
    Four blue pin markers with circular bases in a zigzag pattern, each labeled with percentages and descriptive captions.
    Add to Wishlist
    Download
    AI Customize
    Cross layout with four circular icons in gold tones, each linked by dotted lines, and captions listed vertically on right.
    Add to Wishlist
    Download
    AI Customize
    Slide with an orange upright and a purple inverted triangle, each featuring icons and four numbered captions around them.
    Add to Wishlist
    Download
    AI Customize
    Analysis slide featuring a magnifying glass over banana, with three circular progress charts in green, orange, and yellow.
    Add to Wishlist
    Download
    AI Customize
    Business analytics slide featuring a circular pie chart with percentages representing different business data segments.
    Add to Wishlist
    Download
    AI Customize
    Four staggered colored bars in blue, green, yellow, and purple with icons and captions aligned horizontally.
    Add to Wishlist
    Download
    AI Customize
    Stakeholder analysis slide showing a group of professionals discussing laptops in a meeting room.
    Add to Wishlist
    Download
    AI Customize
    Central speedometer icon with curved black line and five connected colored circles linking labeled sections.