Thematic Analysis PowerPoint Template and Google Slides

The thematic analysis slide diagram shows the process from qualitative data to codes and themes in three colors.
P.ID : 56612
    1.1K+ views
    60 Downloads
    Get Custom Slides by Experts
    Instantly Access Templates in PowerPoint

    Thematic Analysis Presentation Slide  

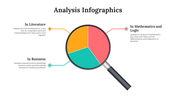
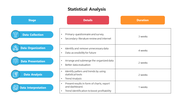
    Thematic analysis is a method used in qualitative research to analyze data by identifying and interpreting patterns of meaning or "themes" within it. It involves identifying recurring patterns, concepts, and ideas across a dataset and grouping them into broader themes. This can help to uncover underlying assumptions, beliefs, and attitudes. Our thematic analysis template can help you organize and analyze your data more effectively, leading to deeper insights and better research outcomes.


    Features of the template:

    • 100% customizable slide and easy to download.
    • The slide contained 16:9 and 4:3 formats.
    • Well-crafted template with an instant download facility.
    • Highly Compatible with PowerPoint and Google Slide.
    • This slide has a colorful design pattern.
    • Content-ready slide with colorful visuals.
    • Easy to change the slide's colors.
    Advertisement

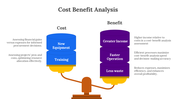
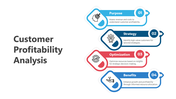
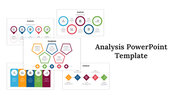
    You May Also Like These PowerPoint Templates

    Add to Wishlist
    Download
    AI Customize
    Three segmented semi circular diagram in blue tones with icons, and a black magnifying glass overlaying a head symbol.
    Free
    Add to Wishlist
    Download
    AI Customize
    Vertical bar chart with five captions and a magnifying glass highlighting one, and numbered list with text on the right.
    Free
    Add to Wishlist
    Download
    AI Customize
    Business slide with two numbered green markers, a magnifying glass over coins, and a group of people analyzing a chart.
    Free
    Add to Wishlist
    Download
    AI Customize
    Business analytics template with five green panels, each showing icons for different analytics concepts.
    Add to Wishlist
    Download
    AI Customize
    Slide featuring four circular progress charts in yellow, pink, blue, and green, with captions on a gray background.
    Add to Wishlist
    Download
    AI Customize
    Analysis PowerPoint template featuring four colorful stages from data interpretation to risk Assessment with icons.
    Add to Wishlist
    Download
    AI Customize
    Three head silhouettes in blue and gray with icons, connected by arrows with captions below, on a white background.
    Add to Wishlist
    Download
    AI Customize
    Analysis PowerPoint template displaying a blue circular diagram with steps from interviewing stakeholders to building BPMN.
    Add to Wishlist
    Download
    AI Customize
    Analysis report template featuring a purple and green area graph comparing five projects, with separate information
    Add to Wishlist
    Download
    AI Customize
    Six oval elements in gray with icons and labels for analysis categories placed in white backdrop.
    Add to Wishlist
    Download
    AI Customize
    Modern design featuring a circular orange arc in the center, flanked by six numbered steps on curved paths on both sides.
    Add to Wishlist
    Download
    AI Customize
    Three vertical blocks in yellow, blue, and green, each with numbers and business analytics icons on a light background.
    Add to Wishlist
    Download
    AI Customize
    A pack of DESC model slides with four elements in various colorful layout designs with text descriptions.
    Add to Wishlist
    Download
    AI Customize
    Circular flowchart with colored arrows in blue, purple, orange, and yellow, pointing to icons and text areas beneath.
    Add to Wishlist
    Download
    AI Customize
    A PowerPoint slide featuring a magnifying glass focusing on data analysis with icons representing various analytics metrics.
    Add to Wishlist
    Download
    AI Customize
    Four step layout with colored tabs in orange, blue, green, and purple, featuring icons and white text boxes.
    Add to Wishlist
    Download
    AI Customize
    A strategic analysis format diagram with a triangle structure representing political, economic, and technological factors.
    Add to Wishlist
    Download
    AI Customize
    Square infographic with four curved arrows in blue, green, orange, and teal, arranged in a cycle for situation analysis.