Best Analytics PowerPoint And Google Slides Template

Analytics slide with line graph, pie chart, and statistics showing 13M views, 13M active subscribers, and 991K subscribers.
P.ID : 9135
    471 views
    32 Downloads
    Get Custom Slides by Experts
    Instantly Access Templates in PowerPoint

    Best Analytics Slide PowerPoint Template


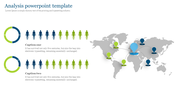
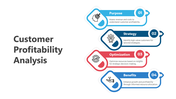
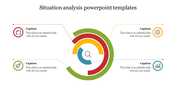
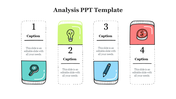
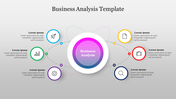
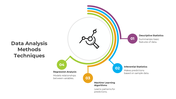
    Analytics is the systematic analysis of data to extract meaningful insights, trends, and patterns. Utilized across various domains, from business to healthcare, analytics informs decision-making processes. It involves data collection, processing, and interpretation, employing statistical methods and algorithms to uncover valuable information. By transforming raw data into actionable knowledge, analytics empowers organizations to enhance efficiency, make informed decisions, and gain a competitive edge in today's data-driven landscape. This concept transcends raw numbers, delving into the strategic analysis of data to extract valuable patterns and trends. Analytics empowers organizations to make informed decisions, optimize processes, and unlock untapped opportunities. Designed for professionals, data analysts, and decision-makers, this Analytics template is an invaluable tool. This template has include graph and charts. Fully editable slides provide adaptability, allowing users to tailor presentations to specific analytical scenarios. Ideal for communicating intricate data findings, it simplifies complex information for enhanced audience comprehension. Benefit from a user friendly interface, seamless visual storytelling, and heightened engagement. Download this template now to elevate your analytics presentations.

    Features of this template


    • 100% customizable slides and easy to download.
    • Template is available in different nodes & colors.
    • The slide contained 16:9 and 4:3 formats.
    • Easy to change the slide colors quickly.
    • It is a well-crafted template with an instant download facility.
    Advertisement

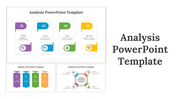
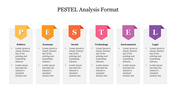
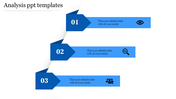
    You May Also Like These PowerPoint Templates

    Add to Wishlist
    Download
    AI Customize
    Six oval elements in gray with icons and labels for analysis categories placed in white backdrop.
    Add to Wishlist
    Download
    AI Customize
    Modern design featuring a circular orange arc in the center, flanked by six numbered steps on curved paths on both sides.
    Add to Wishlist
    Download
    AI Customize
    Three vertical blocks in yellow, blue, and green, each with numbers and business analytics icons on a light background.
    Add to Wishlist
    Download
    AI Customize
    A pack of DESC model slides with four elements in various colorful layout designs with text descriptions.
    Add to Wishlist
    Download
    AI Customize
    Circular flowchart with colored arrows in blue, purple, orange, and yellow, pointing to icons and text areas beneath.
    Add to Wishlist
    Download
    AI Customize
    A PowerPoint slide featuring a magnifying glass focusing on data analysis with icons representing various analytics metrics.
    Add to Wishlist
    Download
    AI Customize
    Four step layout with colored tabs in orange, blue, green, and purple, featuring icons and white text boxes.
    Add to Wishlist
    Download
    AI Customize
    A strategic analysis format diagram with a triangle structure representing political, economic, and technological factors.
    Add to Wishlist
    Download
    AI Customize
    Capability Gap PowerPoint And Google Slides Template
    Add to Wishlist
    Download
    AI Customize
    Structured analytics template with blue visuals and pentagonal icons illustrating three data tracking elements.
    Add to Wishlist
    Download
    AI Customize
    The best break even analysis ppt template model
    Add to Wishlist
    Download
    AI Customize
    Analytics PPT slide showing web analytics uses from traffic source analysis to conversion optimization with icons.
    Add to Wishlist
    Download
    AI Customize
    SWOT diagram with curved arrows in blue, purple, orange, and yellow, pointing to each quadrant.
    Add to Wishlist
    Download
    AI Customize
    Get Involved Observation PowerPoint Template Design
    Add to Wishlist
    Download
    AI Customize
    Analysis themed PowerPoint template with a colorful magnifying glass, document icon, and sections for captions.
    Add to Wishlist
    Download
    AI Customize
    Situational analysis slide, with color coded sections in orange, green, yellow, and blue, for external, internal, and issues.