The Best Business Analysis Presentation template for PPT and Google slides

Business analysis slide with cartoon characters and bar charts, highlighting growth, analysis, and successful outcome stages.
P.ID : 16714
    11 slides
    RATER Model slides displaying vibrant icons and text sections, emphasizing key service quality dimensions.
    12 slides
    Competitive analysis slides featuring various comparison tables and rating charts for evaluating competitors.
    11 slides
    Slide deck showcasing cost effectiveness analysis with a triangular infographic and colorful supporting charts.
    354 views
    35 Downloads
    Get Custom Slides by Experts
    Instantly Access Templates in PowerPoint

    Modern Business Analysis Presentation template 


    The task of giving a business analysis presentation with a deadly punch under the pressure of time? This Business Analysis Presentation template for PowerPoint and Google Slides is your "secret weapon" to leave the audience in awe!
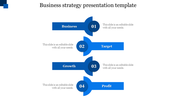
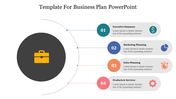
    Visualize a slide with three cool pictures showing the main points of your analysis. Each picture has space for details - the problem you solved, how you solved it, and your big discoveries.
    This is the best thing for business analysts who are explaining projects, consultants who are sharing recommendations, or even project managers who are keeping everyone in line.
    No more boring presentations with only text! This template lets you use pictures to make your analysis easy to understand and simple.
    Do not do presentations that confuse people. Grab our business analysis template right now and create presentations that are both informative and visually appealing! In addition, it can be easily customized to fit any analysis you have done. Get ready to change your analysis into a clear and attractive presentation.


    Features of the template


    • 100% customizable slides and easy to download.
    • The slides contain 16:9 and 4:3 formats.
    • Easy to change the colors quickly.
    • It is a well-crafted template with an instant download facility.
    • It is a 100% pre-designed slide.
    • The slide holds vibrant colors.
    Advertisement

    You May Also Like These PowerPoint Templates

    Add to Wishlist
    Download
    AI Customize
    Growth analysis PowerPoint template with four steps and a computer showing bar chart analysis.
    Add to Wishlist
    Download
    AI Customize
    Root cause analysis slide with a tree diagram and four labeled colored boxes on branches, with three captions at the bottom.
    Free
    Add to Wishlist
    Download
    AI Customize
    Map-based analysis design with statistical data visuals including circular graphs and demographic distributions.
    Add to Wishlist
    Download
    AI Customize
    Circular infographic with a central globe icon connected to eight color-coded nodes for analytics techniques.
    Free
    Add to Wishlist
    Download
    AI Customize
    Colorful radial design with six segments around a red analysis icon, highlighting key analytics strategies.
    Add to Wishlist
    Download
    AI Customize
    Five colorful oval shapes in blue, green, red, orange, and teal, with shadow effects, featuring icons and captions inside.
    Add to Wishlist
    Download
    AI Customize
    Side-by-side Pareto analysis blocks with 20% and 80% sections, representing complaints and reasons in contrasting colors.
    Add to Wishlist
    Download
    AI Customize
    Capabilities analysis template featuring color coded categories on the left and a circular percentage chart on the right.
    Add to Wishlist
    Download
    AI Customize
    Circular diagram with four segments in yellow, green, blue, and teal, each containing icons around a white central circle.
    Add to Wishlist
    Download
    AI Customize
    Use Performance PowerPoint And Google Slides Template
    Add to Wishlist
    Download
    AI Customize
    Illustration of a woman analyzing colorful bar and pie charts, with three color coded circular icons on the right.
    Add to Wishlist
    Download
    AI Customize
    Five numbered interconnected puzzle pieces in red, green, purple, teal, and blue, with human illustrations above.
    Add to Wishlist
    Download
    AI Customize
    Vibrant PESTLE chart dividing political, economic, social, technological, legal, and environmental aspects.
    Add to Wishlist
    Download
    AI Customize
    Analysis template with a man looking through a magnifying glass at a computer screen with four types and caption areas.
    Add to Wishlist
    Download
    AI Customize
    Step-by-step analysis diagram with a central focus on analysis, flanked by six green-highlighted steps.
    Add to Wishlist
    Download
    AI Customize
    Molecular-style infographic with interconnected colored nodes linked to six labeled captions for analysis ideas.
    Add to Wishlist
    Download
    AI Customize
    Central hexagonal shape with multicolor triangles around and two text areas with bar chart and coin stack with percentages.
    Add to Wishlist
    Download
    AI Customize
    Business Analytics slide featuring three stages with icons representing question, insight, and growth.