Attractive Business Analytics PowerPoint Template Design

Attractive Business Analytics PowerPoint Template Design
P.ID : 12837
    413 views
    23 Downloads
    Get Custom Slides by Experts
    Instantly Access Templates in PowerPoint

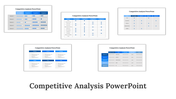
    Best Business Analytics Process PowerPoint Model Template For Presentation


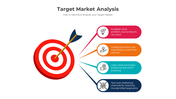
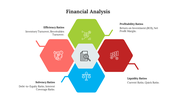
    Download the new impressive zig-zag business analytics process PPT power point to deliver an inspiring business presentation. This template has multiple colors that look very impressive and professional. The icons used here in these templates are highly recommended for businesses to make perfect analytics over your business. The zig-zag design of this template helps add business plans, clients, deadlines, projects, targets, goals, etc. You can easily professionally add all these things. The percentage value helps in concentrating the business more, and also, it will expose the activities clearly without any mess up. Use this business analytics process PPT to make great business analytical presentations. 

    Features of this template:


    • 100 % customizable slides and easy to download.
    • Slides available in different nodes & colors.
    • The slide contained in 16:9 and 4:3 format.
    • Easy to change the slide colors quickly.
    • Well-crafted template with instant download facility.
    • The clear layout of this template will help you to design a professional-looking presentation.
    • The multi-color visuals of this slide will make your presentation eye-catching.

    Advertisement

    You May Also Like These PowerPoint Templates

    Add to Wishlist
    Download
    AI Customize
    Analysis slide with five colored bars in green, red, yellow, navy, and blue, each with hexagonal icons and numbered circles.
    Add to Wishlist
    Download
    AI Customize
    A slide showing a situation analysis template with four colorful sections with placeholder text.
    Add to Wishlist
    Download
    AI Customize
    Competitive analysis slides featuring various comparison tables and rating charts for evaluating competitors.
    Add to Wishlist
    Download
    AI Customize
    Slide featuring three overlapping circles in blue, red, and green with key points, alongside a yellow topped text box.
    Add to Wishlist
    Download
    AI Customize
    Five numbered hexagons in red, orange, green, teal, and blue, each with text inside.
    Add to Wishlist
    Download
    AI Customize
    Risk analysis chart listing potential risks, their likelihood and impact scores, and priority rankings.
    Add to Wishlist
    Download
    AI Customize
    Slide deck showcasing cost effectiveness analysis with a triangular infographic and colorful supporting charts.
    Add to Wishlist
    Download
    AI Customize
    A colorful business forecasting slide featuring a puzzle like layout that outlines key advantages.
    Add to Wishlist
    Download
    AI Customize
    Market analysis template with seven numbered steps arranged around a central magnifying glass icon over a pink background.
    Add to Wishlist
    Download
    AI Customize
    A business analytics PowerPoint slide with icons surrounding a magnifying glass and a book with captions on a dark theme.
    Add to Wishlist
    Download
    AI Customize
    Finance-themed slide with an orange balance scale graphic and donut charts showing different percentages on the left.
    Free
    Add to Wishlist
    Download
    AI Customize
    Three vertical capsule shaped charts in pink, gray, and red on a dark background, with a large orange arrow at the bottom.
    Add to Wishlist
    Download
    AI Customize
    Growth analysis PowerPoint template with four steps and a computer showing bar chart analysis.
    Add to Wishlist
    Download
    AI Customize
    Infographic design featuring a magnifying glass lens divided into four quadrants, each representing a type of analysis.
    Add to Wishlist
    Download
    AI Customize
    Root cause analysis slide with a tree diagram and four labeled colored boxes on branches, with three captions at the bottom.
    Free
    Add to Wishlist
    Download
    AI Customize
    Map-based analysis design with statistical data visuals including circular graphs and demographic distributions.
    Add to Wishlist
    Download
    AI Customize
    Circular infographic with a central globe icon connected to eight color-coded nodes for analytics techniques.