Colorful Analytics PowerPoint Presentation Slides - Arrow Point

Colorful horizontal arrows in blue, green, orange, purple, and red pointing left, aligned with circular icons and captions.
P.ID : 10306
    633 views
    47 Downloads
    Designer
    Kavitha
    Get Custom Slides by Experts
    Enhance Your Presentations with Add-ins
    Google Slides Add-in
    Access templates directly in Google Slides
    Microsoft PowerPoint Add-in
    Access templates directly in PowerPoint
    GPT Add-on
    AI-powered presentation assistance

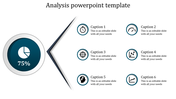
    Analytics PowerPoint Template


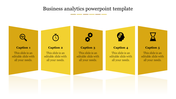
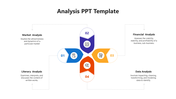
    Crafting analytical presentations that effectively convey insights can be a challenge, especially when organizing data in a clear and visually appealing manner. To address this, we present our analytics PowerPoint template.


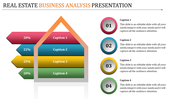
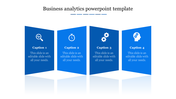
    Divided into five sections, each section features a numbered caption placeholder and space to add content, ensuring a structured and organized presentation. The captions are sequentially numbered from 1 to 5, with the year of creation displayed beneath each, providing context and relevance to your data.


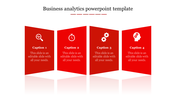
    Against a crisp white background, arrows elegantly point to each section, guiding your audience through the analytical journey. This layout enhances comprehension and engagement, allowing viewers to follow the flow of information seamlessly.


    Whether you're showcasing trends, forecasts, or performance metrics, our analytics PPT template offers a versatile framework to present your data effectively. Elevate your presentations with clarity and professionalism, and empower your audience with actionable insights.


    Features of the template

    • 100% customizable slides and easy to download.
    • Slides are available in different nodes & colors.
    • The slide contains 16:9 and 4:3 formats.
    • It is easy to change the colors of the slide quickly. 
    • Well-crafted template with an instant download facility.

    Advertisement

    You May Also Like These PowerPoint Templates

    Free
    Add to Wishlist
    Download
    Edit
    Silhouette of a businessman at the center, connected to six colorful caption boxes with numbered steps on both sides.
    Free
    Add to Wishlist
    Download
    Edit
    Slide illustrating an analysis process with four colored blocks in different stages each with percentage values and captions.
    Free
    Add to Wishlist
    Download
    Edit
    Blue themed business infographic with five angled sections, icons, and text placeholders for analytics insights.
    Free
    Add to Wishlist
    Download
    Edit
    Business analytics design slide featuring five orange blocks, each with an icon representing with caption areas.
    Free
    Add to Wishlist
    Download
    Edit
    Circular layout with arrows connecting blocks for SWOT elements in orange, green, beige, and red.
    Free
    Add to Wishlist
    Download
    Edit
    Engineer-focused slide with a figure in a yellow hard hat, flanked by green arrows denoting processes.
    Add to Wishlist
    Download
    Edit
    Four column SWOT template featuring blue, red, green, and yellow boxes, each with icons and text placeholders.
    Free
    Add to Wishlist
    Download
    Edit
    Timeline template showing a journey from 2016 to 2020 with icons for research, finance, analytics, intelligence, and success.