Impress your Audience with Analysis Presentation Template


Decode Your Data: Analysis Templates and Themes for Presentations
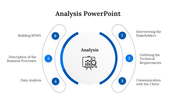
Turn mountains of data into clear insights with this Analysis Template for PowerPoint and Google Slides.
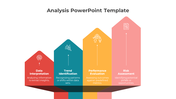
Three simple slides guide your story:
- Goal: Define your objective and identify the data you need.
- Explore: Uncover hidden patterns and trends in your data.
- Insights: Present your findings and actionable recommendations.
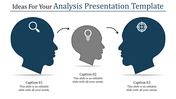
Customize captions, titles, and text for a presentation that's uniquely yours.
Perfect for:
- Business professionals explaining data-driven strategies.
- Consultants delivering clear and persuasive findings.
- Educators transforming data into engaging lessons.
Simplify data communication. Download this template now!
This easy-to-use template offers:
- Clear Framework: Three steps for impactful data analysis presentations.
- Full Customization: Tailor each slide to your specific data and audience.
Stop struggling with data. Start illuminating your insights!
Features of the Template
- 100 % customizable slides.
- The slide show is in 4:3, 16:9, zip format.
- There is powerful connectivity with Google Slides and PowerPoint.
- It is simple and quick to alter the slide's color.
- An efficient template that can be easily accessed immediately.
- Well-crafted template with an instant download facility.


You May Also Like These PowerPoint Templates
Add to Wishlist
Download
AI Customize

Add to Wishlist
Download
AI Customize

Add to Wishlist
Download
AI Customize

Add to Wishlist
Download
AI Customize

Add to Wishlist
Download
AI Customize

Add to Wishlist
Download
AI Customize

Add to Wishlist
Download
AI Customize

Add to Wishlist
Download
AI Customize

Add to Wishlist
Download
AI Customize

Add to Wishlist
Download
AI Customize

Add to Wishlist
Download
AI Customize

Add to Wishlist
Download
AI Customize

Add to Wishlist
Download
AI Customize

Add to Wishlist
Download
AI Customize

Add to Wishlist
Download
AI Customize

Add to Wishlist
Download
AI Customize

Add to Wishlist
Download
AI Customize

Add to Wishlist
Download
AI Customize

Add to Wishlist
Download
AI Customize

Add to Wishlist
Download
AI Customize
