Everlasting Analysis PPT and Google Slides Template

Yellow pie chart divided into Analysis 1, 2, and 3 segments, focused by a black magnifying glass icon.
P.ID : 28318
    11 slides
    RATER Model slides displaying vibrant icons and text sections, emphasizing key service quality dimensions.
    12 slides
    Competitive analysis slides featuring various comparison tables and rating charts for evaluating competitors.
    11 slides
    Slide deck showcasing cost effectiveness analysis with a triangular infographic and colorful supporting charts.
    205 views
    23 Downloads
    Get Custom Slides by Experts
    Instantly Access Templates in PowerPoint

    Analysis PowerPoint Template


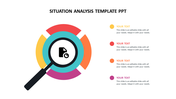
    Convey your business insights to your audience by making use of our Analysis PPT and Google Slides Template. The slide offers a visual representation of analytical processes. It is designed to attract your audience and convey insights with precision. At the center of the slide, a semi-circle is divided into three distinct sections. Each of them comes with icons representing strategies, observation and analysis. 

    These icons guide viewers through the stages of analytical thinking. A suitable template for analysts, consultants and professionals across various industries. Ideal for delivering market research insights, financial forecasts or performance evaluations. Download today to illustrate the attention to detail required for effective analysis.

    Features of the template

    • The slide contains 16:9 and 4:3 formats.
    • Compatible with Google slide themes and PowerPoint.
    • 100% customizable slides and easy to download.
    • It is easy to change the colors of the slide quickly.
    • Well-crafted template with an instant download facility.
    Advertisement

    You May Also Like These PowerPoint Templates

    Add to Wishlist
    Download
    AI Customize
    A business analytics PowerPoint slide with icons surrounding a magnifying glass and a book with captions on a dark theme.
    Add to Wishlist
    Download
    AI Customize
    Growth analysis PowerPoint template with four steps and a computer showing bar chart analysis.
    Add to Wishlist
    Download
    AI Customize
    Root cause analysis slide with a tree diagram and four labeled colored boxes on branches, with three captions at the bottom.
    Free
    Add to Wishlist
    Download
    AI Customize
    Map-based analysis design with statistical data visuals including circular graphs and demographic distributions.
    Add to Wishlist
    Download
    AI Customize
    Circular infographic with a central globe icon connected to eight color-coded nodes for analytics techniques.
    Free
    Add to Wishlist
    Download
    AI Customize
    Colorful radial design with six segments around a red analysis icon, highlighting key analytics strategies.
    Add to Wishlist
    Download
    AI Customize
    Five colorful oval shapes in blue, green, red, orange, and teal, with shadow effects, featuring icons and captions inside.
    Add to Wishlist
    Download
    AI Customize
    Side-by-side Pareto analysis blocks with 20% and 80% sections, representing complaints and reasons in contrasting colors.
    Add to Wishlist
    Download
    AI Customize
    Capabilities analysis template featuring color coded categories on the left and a circular percentage chart on the right.
    Add to Wishlist
    Download
    AI Customize
    Circular diagram with four segments in yellow, green, blue, and teal, each containing icons around a white central circle.
    Add to Wishlist
    Download
    AI Customize
    Use Performance PowerPoint And Google Slides Template
    Add to Wishlist
    Download
    AI Customize
    Illustration of a woman analyzing colorful bar and pie charts, with three color coded circular icons on the right.
    Add to Wishlist
    Download
    AI Customize
    Five numbered interconnected puzzle pieces in red, green, purple, teal, and blue, with human illustrations above.
    Add to Wishlist
    Download
    AI Customize
    Vibrant PESTLE chart dividing political, economic, social, technological, legal, and environmental aspects.
    Add to Wishlist
    Download
    AI Customize
    Analysis template with a man looking through a magnifying glass at a computer screen with four types and caption areas.
    Add to Wishlist
    Download
    AI Customize
    Step-by-step analysis diagram with a central focus on analysis, flanked by six green-highlighted steps.
    Add to Wishlist
    Download
    AI Customize
    Molecular-style infographic with interconnected colored nodes linked to six labeled captions for analysis ideas.