Free - Analytics Presentation Template

Free
Blue themed slide with two square icons on tilted diamonds and two rectangular caption boxes on the right.
P.ID : 9144
    253 views
    48 Downloads
    Get Custom Slides by Experts
    Instantly Access Templates in PowerPoint

    Analytics Presentation Template

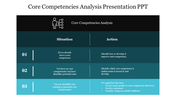
    The image is a slide from a presentation. The slide is titled "Big Corporation To Have A Great Analytics Presentation Template". It has two blue squares on a dark blue background. Each square has a white icon in it. The left square has a calculator icon, and the right square has a database icon. 

    Designed for professionals, analysts, and decision-makers, this template is tailor-made for presenting analytics reports, financial insights, and data-driven strategies

    Ideal for data analysts, financial experts, business intelligence professionals, and executives looking to communicate analytics findings. Whether you're presenting to your team, stakeholders, or clients, this template ensures your analytics story is visually compelling and easy to understand.

    Available in both "16:9" and "4:3" formats for flexibility across different screen dimensions.
    Zip formats for convenient sharing and accessibility. 100% customizable, allowing you to tailor the presentation to suit your specific analytics needs. Download our template now and captivate your audience with the power of analytics storytelling!
    Advertisement

    You May Also Like These PowerPoint Templates

    Add to Wishlist
    Download
    AI Customize
    Slide featuring five colorful cylindrical bar charts labeled with data analytics categories with percentages from 23% to 75%.
    Add to Wishlist
    Download
    AI Customize
    Colorful horizontal layout with arrows in turquoise, purple, red, and orange, showcasing a value chain structure.
    Add to Wishlist
    Download
    AI Customize
    Four rectangular blocks in purple, red, blue, and green displaying text with circular icons on the left.
    Add to Wishlist
    Download
    AI Customize
    Slide with three green sections in a vertical layout, each featuring icons for traffic, behavior tracking, and optimization.
    Add to Wishlist
    Download
    AI Customize
    Four colored analysis circles with icons of data charts, computer screen, bar graphs, and gears, analysis with caption areas.
    Add to Wishlist
    Download
    AI Customize
    Situation analysis slide featuring a central magnifying glass over a circular diagram with four colorful segments around it.
    Add to Wishlist
    Download
    AI Customize
    Marketing plan template with PESTLE analysis, featuring colorful icons for each factor with captions.
    Add to Wishlist
    Download
    AI Customize
    Research paper slide with six key sections from introduction to further recommendation with icons and text.
    Add to Wishlist
    Download
    AI Customize
    Diagram for SOAR analysis divided into four quadrants with central focus and supporting textual details.
    Add to Wishlist
    Download
    AI Customize
    Stakeholder analysis with rows of blue and gray icons representing different levels of engagement.
    Add to Wishlist
    Download
    AI Customize
    Analysis slide with five colored bars in green, red, yellow, navy, and blue, each with hexagonal icons and numbered circles.
    Add to Wishlist
    Download
    AI Customize
    A slide showing a situation analysis template with four colorful sections with placeholder text.
    Add to Wishlist
    Download
    AI Customize
    Competitive analysis slides featuring various comparison tables and rating charts for evaluating competitors.
    Add to Wishlist
    Download
    AI Customize
    Slide featuring three overlapping circles in blue, red, and green with key points, alongside a yellow topped text box.
    Add to Wishlist
    Download
    AI Customize
    Five numbered hexagons in red, orange, green, teal, and blue, each with text inside.
    Add to Wishlist
    Download
    AI Customize
    Slide deck showcasing cost effectiveness analysis with a triangular infographic and colorful supporting charts.
    Add to Wishlist
    Download
    AI Customize
    A colorful business forecasting slide featuring a puzzle like layout that outlines key advantages.
    Add to Wishlist
    Download
    AI Customize
    Market analysis template with seven numbered steps arranged around a central magnifying glass icon over a pink background.
    Add to Wishlist
    Download
    AI Customize
    A business analytics PowerPoint slide with icons surrounding a magnifying glass and a book with captions on a dark theme.