Performance Evaluation PowerPoint And Google Slides

Pack of 11 slides
P.ID : 71551
Advertisement
306 views
54 Downloads
Get Custom Slides by Experts
Instantly Access Templates in PowerPoint

Performance Evaluation Presentation Slides


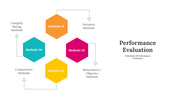
Performance Evaluation is a fundamental process within organizations, aiming to assess and appraise the performance of individuals, teams, or the entire workforce. This concept acknowledges that tracking and evaluating performance is essential for growth and development, both at the individual and organizational levels. It involves the systematic review of goals, achievements, strengths, and areas for improvement. Performance Evaluation provides valuable insights for making informed decisions related to promotions, training, and compensation. It fosters a culture of accountability and continuous improvement, motivating employees to excel in their roles. This process is not only about assessing past performance but also setting clear expectations for the future. Understanding and implementing effective Performance Evaluation is vital for organizations looking to optimize productivity, enhance employee engagement, and achieve their strategic objectives. This is where the Performance Evaluation PowerPoint template becomes an indispensable tool. Designed for HR professionals, managers, and team leaders tasked with conducting performance evaluations and presenting the results, this template simplifies the complex process of conveying performance metrics, facilitating discussions, and setting clear goals for improvement. Featuring fully editable slides, it allows presenters to customize content, colors, and layouts, aligning the presentation with their organization's performance evaluation process and objectives. By leveraging this template, presenters enhance the professionalism and impact of their performance evaluation presentations, saving time in designing materials and ensuring clarity and consistency throughout the evaluation process. Encouraging the audience to embrace this template for their performance evaluations, it empowers organizations to conduct more efficient and constructive evaluations, ultimately driving individual and organizational growth.


Features of the templates:


  • 100% customizable slides and easy to download.
  • Slides are available in different nodes & colors.
  • The slide contains 16:9 and 4:3 formats.
  • Easy to change the colors of the slide quickly.
  • Highly compatible with PowerPoint and Google Slides.
  • Well-crafted template with an instant download facility.

You May Also Like These PowerPoint Templates

Add to Wishlist
Download
AI Customize
Infographic design featuring a magnifying glass lens divided into four quadrants, each representing a type of analysis.
Add to Wishlist
Download
AI Customize
Root cause analysis slide with a tree diagram and four labeled colored boxes on branches, with three captions at the bottom.
Add to Wishlist
Download
AI Customize
Circular infographic with a central globe icon connected to eight color-coded nodes for analytics techniques.
Free
Add to Wishlist
Download
AI Customize
Colorful radial design with six segments around a red analysis icon, highlighting key analytics strategies.
Add to Wishlist
Download
AI Customize
Five colorful oval shapes in blue, green, red, orange, and teal, with shadow effects, featuring icons and captions inside.
Add to Wishlist
Download
AI Customize
Side-by-side Pareto analysis blocks with 20% and 80% sections, representing complaints and reasons in contrasting colors.
Add to Wishlist
Download
AI Customize
Capabilities analysis template featuring color coded categories on the left and a circular percentage chart on the right.
Add to Wishlist
Download
AI Customize
Circular diagram with four segments in yellow, green, blue, and teal, each containing icons around a white central circle.
Add to Wishlist
Download
AI Customize
Use Performance PowerPoint And Google Slides Template
Add to Wishlist
Download
AI Customize
Illustration of a woman analyzing colorful bar and pie charts, with three color coded circular icons on the right.
Add to Wishlist
Download
AI Customize
Five numbered interconnected puzzle pieces in red, green, purple, teal, and blue, with human illustrations above.
Add to Wishlist
Download
AI Customize
Analysis template with a man looking through a magnifying glass at a computer screen with four types and caption areas.
Add to Wishlist
Download
AI Customize
Step-by-step analysis diagram with a central focus on analysis, flanked by six green-highlighted steps.
Add to Wishlist
Download
AI Customize
Data analytics layout featuring a central gray magnifying glass and three orange icons linked to labeled sections.
Add to Wishlist
Download
AI Customize
Molecular-style infographic with interconnected colored nodes linked to six labeled captions for analysis ideas.
Add to Wishlist
Download
AI Customize
Central hexagonal shape with multicolor triangles around and two text areas with bar chart and coin stack with percentages.
Add to Wishlist
Download
AI Customize
Business Analytics slide featuring three stages with icons representing question, insight, and growth.
Add to Wishlist
Download
AI Customize
Data analysis template with a bar graph and illustrated dashboard layout with two caption areas for data.
Add to Wishlist
Download
AI Customize
Illustration of a person analyzing charts in blue accents, with four analysis types listed on the right.
Add to Wishlist
Download
AI Customize
Four colorful vertical banners in yellow, red, blue, and green with icons, title, and descriptions for web analytics uses.
Add to Wishlist
Download
AI Customize
Data analysis featuring icons for data interpretation, market research, and performance evaluation.
Free
Add to Wishlist
Download
AI Customize
Amazing Business Analytics PPT Templates and Google Slides
Add to Wishlist
Download
AI Customize
 slide featuring three circular charts for data analysis, followed by a line chart displaying monthly trends.
Add to Wishlist
Download
AI Customize
Banking data analysis slide with green bar chart on a computer screen and three listed issues in circles on the right.
Add to Wishlist
Download
AI Customize
Data analysis slide with a monitor showing analytics icons, and five colorful speech bubbles indicating various steps around it.
Add to Wishlist
Download
AI Customize
Slide with an orange upright and a purple inverted triangle, each featuring icons and four numbered captions around them.
Add to Wishlist
Download
AI Customize
Analysis slide featuring a magnifying glass over banana, with three circular progress charts in green, orange, and yellow.
Add to Wishlist
Download
AI Customize
Four staggered colored bars in blue, green, yellow, and purple with icons and captions aligned horizontally.
Add to Wishlist
Download
AI Customize
Stakeholder analysis slide showing a group of professionals discussing laptops in a meeting room.
Add to Wishlist
Download
AI Customize
Central speedometer icon with curved black line and five connected colored circles linking labeled sections.
Add to Wishlist
Download
AI Customize
Three segmented semi circular diagram in blue tones with icons, and a black magnifying glass overlaying a head symbol.