Easy To Edit Performance PPT And Google Slides Themes

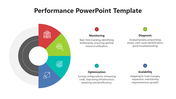

Performance PowerPoint Template
Performance refers to the measurable and qualitative output of an individual, team, or organization in achieving goals and objectives, reflecting efficiency, effectiveness, and overall success in various endeavors. Explore the performance PowerPoint template, a comprehensive guide covering organizational, individual, managerial, and HR factors contributing to optimal performance. This fully editable slide serves a broad audience, including managers, HR professionals, and organizational leaders. Users will find this template immensely useful for presenting strategies that enhance overall performance, fostering a positive and enthusiastic environment. With the ability to tailor content to specific needs, this template benefits presenters by providing a structured framework for communicating essential performance factors. Encouraging its use, this content emphasizes the advantages of a user-friendly and visually appealing presentation, urging the audience to download this template for a seamless and impactful presentation experience.
Features of this template
- 100% customizable slides and easy to download.
- The slide contains 16:9 and 4:3 formats.
- Easy to change the colors of the slide quickly.
- Highly compatible with PowerPoint and Google Slides.
- Well-crafted template with an instant download facility.


You May Also Like These PowerPoint Templates


