Simple Chart Based Analysis PowerPoint Template


Best Data Analysis PPT Template
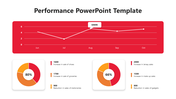
Introducing our refined Analytics PowerPoint templates, designed to breathe life into your data and up your communication game. It shows a line graph chart that visually shows the size of four data sets in six sessions.
Graph Features:
X-Axis: Labeled “Assembly” (S1 to S6).
Y-Axis: “Quantity score” is written, with a value ranging from -30% to 10%.
- Circle symbols on the right correspond to each data set, providing a visual reference.
- Business Analyst: Able to analyze trends and changes in production levels in forums.
- Statistician: Able to interpret data and identify patterns.
- Decision makers: Appropriate decisions can be made based on product information.
Remember that this slide is customizable, allowing you to adapt it to specific needs. Whether it’s tracking productivity, identifying challenges, or improving processes, this presentation can help anyone involved in product analysis and decision making so download our Data Analysis PowerPoint Templates and Google Slides Themes.
Features of the template
- Slides are available in 4:3 & 16:9
- Well-crafted template with instant download.
- Get slides that are 100% customizable and easy to download


You May Also Like These PowerPoint Templates
Add to Wishlist
Download
AI Customize

Add to Wishlist
Download
AI Customize

Add to Wishlist
Download
AI Customize

Add to Wishlist
Download
AI Customize

Add to Wishlist
Download
AI Customize

Add to Wishlist
Download
AI Customize

Add to Wishlist
Download
AI Customize


Add to Wishlist
Download
AI Customize

Add to Wishlist
Download
AI Customize

Add to Wishlist
Download
AI Customize

Add to Wishlist
Download
AI Customize

Add to Wishlist
Download
AI Customize

Add to Wishlist
Download
AI Customize


Add to Wishlist
Download
AI Customize


Add to Wishlist
Download
AI Customize

Free
Add to Wishlist
Download
AI Customize
