Free - Elegant Business Analytics PowerPoint Template Presentation

Free
Business analytics template with four orange tilted panels, each featuring an icon, caption, and description.
P.ID : 37416
    297 views
    108 Downloads
    Get Custom Slides by Experts
    Instantly Access Templates in PowerPoint

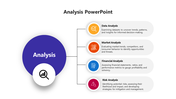
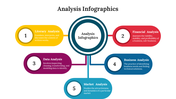
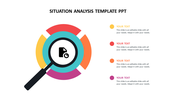
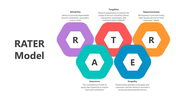
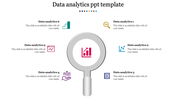
    Business Analytics Presentation Slide

    Business analytics is a process that uses data and statics methods to gain wisdom. The process helps the organization to reduce costs and increase revenue. It involves data from sales, marketing, finance, and customer behavior. The method identifies the strengths and weaknesses of the company. Finance, supply chain management, and human resources use this business analytics for success. Let's try this template to impress your customers in an engaging way. 

    Features of the template

    • 100% customizable slides and easy to download.
    • Slides are available in different nodes & colors.
    • The slide contains 16:9 and 4:3 formats.
    • Easy to change the colors of the slide quickly.
    • Well-crafted template with an instant download facility.
    • This slide is compatible with PowerPoint and google slides.
    • The template includes charts and graphs.
    • Drive your business forward with business analytics.
    Advertisement

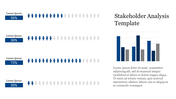
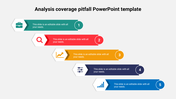
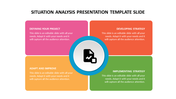
    You May Also Like These PowerPoint Templates

    Add to Wishlist
    Download
    AI Customize
    Five-step performance framework, with colored sections, outlining stages from setting goals to rewarding achievements.
    Add to Wishlist
    Download
    AI Customize
    Five numbered hexagons in red, orange, green, teal, and blue, each with text inside.
    Add to Wishlist
    Download
    AI Customize
    Slide deck showcasing cost effectiveness analysis with a triangular infographic and colorful supporting charts.
    Add to Wishlist
    Download
    AI Customize
    A colorful business forecasting slide featuring a puzzle like layout that outlines key advantages.
    Add to Wishlist
    Download
    AI Customize
    Market analysis template with seven numbered steps arranged around a central magnifying glass icon over a pink background.
    Add to Wishlist
    Download
    AI Customize
    Slide displaying market analysis with two sections showing percentages for Analysis 01 and 02, with icons and text.
    Add to Wishlist
    Download
    AI Customize
    A business analytics PowerPoint slide with icons surrounding a magnifying glass and a book with captions on a dark theme.
    Add to Wishlist
    Download
    AI Customize
    Growth analysis PowerPoint template with four steps and a computer showing bar chart analysis.
    Add to Wishlist
    Download
    AI Customize
    Root cause analysis slide with a tree diagram and four labeled colored boxes on branches, with three captions at the bottom.
    Add to Wishlist
    Download
    AI Customize
    Circular infographic with a central globe icon connected to eight color-coded nodes for analytics techniques.
    Free
    Add to Wishlist
    Download
    AI Customize
    Colorful radial design with six segments around a red analysis icon, highlighting key analytics strategies.
    Add to Wishlist
    Download
    AI Customize
    Five colorful oval shapes in blue, green, red, orange, and teal, with shadow effects, featuring icons and captions inside.
    Add to Wishlist
    Download
    AI Customize
    Side-by-side Pareto analysis blocks with 20% and 80% sections, representing complaints and reasons in contrasting colors.
    Add to Wishlist
    Download
    AI Customize
    Capabilities analysis template featuring color coded categories on the left and a circular percentage chart on the right.
    Add to Wishlist
    Download
    AI Customize
    Circular diagram with four segments in yellow, green, blue, and teal, each containing icons around a white central circle.
    Add to Wishlist
    Download
    AI Customize
    Use Performance PowerPoint And Google Slides Template
    Add to Wishlist
    Download
    AI Customize
    Illustration of a woman analyzing colorful bar and pie charts, with three color coded circular icons on the right.
    Add to Wishlist
    Download
    AI Customize
    Five numbered interconnected puzzle pieces in red, green, purple, teal, and blue, with human illustrations above.