Stakeholder Analysis Template PPT Presentation Slide

Stakeholder analysis with rows of blue and gray icons representing different levels of engagement.
P.ID : 59291
    126 views
    16 Downloads
    Get Custom Slides by Experts
    Instantly Access Templates in PowerPoint

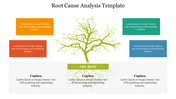
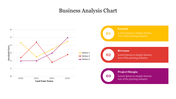
    Four Noded Stakeholder Analysis PPT Slide


    Download this Stakeholder Analysis Template to explain the business processes and financials to a diverse group of stakeholders. The visual aspect of this tool can make it easier for your audience to grasp the concepts. This pre-formatted slide is compatible with all versions of the PowerPoint and Google Slides. You can easily customize the slide layout according to your needs. 

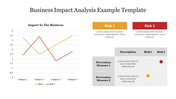
    The Stakeholder Analysis PPT Template will make your presentations more engaging and more impactful. It is a four noded slide. It includes a bar graph to visualize your analysis report. The blue and white colors used in this slide will give your presentations an attractive and elegant look. This professionally-made slide will make it easy for you to present your analysis in an attractive way. 

    Features of this template:

    1. 100% customizable slides and easy to download.
    2. Slides available in different nodes & colors.
    3. The slide contained 16:9 and 4:3 format.
    4. Easy to change the slide colors quickly.
    5. Well-crafted template with instant download facility.
    6. It is a creative slide.
    Advertisement

    You May Also Like These PowerPoint Templates

    Add to Wishlist
    Download
    AI Customize
    Vibrant PESTLE chart dividing political, economic, social, technological, legal, and environmental aspects.
    Add to Wishlist
    Download
    AI Customize
    Analysis template with a man looking through a magnifying glass at a computer screen with four types and caption areas.
    Add to Wishlist
    Download
    AI Customize
    Step-by-step analysis diagram with a central focus on analysis, flanked by six green-highlighted steps.
    Add to Wishlist
    Download
    AI Customize
    Molecular-style infographic with interconnected colored nodes linked to six labeled captions for analysis ideas.
    Add to Wishlist
    Download
    AI Customize
    Central hexagonal shape with multicolor triangles around and two text areas with bar chart and coin stack with percentages.
    Add to Wishlist
    Download
    AI Customize
    Business Analytics slide featuring three stages with icons representing question, insight, and growth.
    Add to Wishlist
    Download
    AI Customize
    Four circular progress charts in yellow, blue, orange, and pink above text boxes, showcasing percentage values.
    Add to Wishlist
    Download
    AI Customize
    Data analysis template with a bar graph and illustrated dashboard layout with two caption areas for data.
    Add to Wishlist
    Download
    AI Customize
    Illustration of a person analyzing charts in blue accents, with four analysis types listed on the right.
    Add to Wishlist
    Download
    AI Customize
    Grid layout with five red boxes for why labels and three columns in blue, green, and purple for answers.
    Add to Wishlist
    Download
    AI Customize
    Four colorful vertical banners in yellow, red, blue, and green with icons, title, and descriptions for web analytics uses.
    Add to Wishlist
    Download
    AI Customize
    Data analysis featuring icons for data interpretation, market research, and performance evaluation.
    Add to Wishlist
    Download
    AI Customize
    Competitor analysis chart with four quadrants representing high and low price and quality, showing competitor circles.
    Free
    Add to Wishlist
    Download
    AI Customize
    Amazing Business Analytics PPT Templates and Google Slides
    Add to Wishlist
    Download
    AI Customize
     slide featuring three circular charts for data analysis, followed by a line chart displaying monthly trends.
    Add to Wishlist
    Download
    AI Customize
    Banking data analysis slide with green bar chart on a computer screen and three listed issues in circles on the right.
    Add to Wishlist
    Download
    AI Customize
    Data analysis slide with a monitor showing analytics icons, and five colorful speech bubbles indicating various steps around it.
    Add to Wishlist
    Download
    AI Customize
    Slide with a blue sidebar featuring a document icon, two captions in yellow and orange circles, and text at bottom.
    Add to Wishlist
    Download
    AI Customize
    Four blue pin markers with circular bases in a zigzag pattern, each labeled with percentages and descriptive captions.
    Add to Wishlist
    Download
    AI Customize
    Cross layout with four circular icons in gold tones, each linked by dotted lines, and captions listed vertically on right.