Analytics Powerpoint Template for PowerPoint & Google Slides

Slide with three green sections in a vertical layout, each featuring icons for traffic, behavior tracking, and optimization.
P.ID : 23167
    13 slides
    A pack of DESC model slides with four elements in various colorful layout designs with text descriptions.
    16 slides
    Set of slides on capability gap analysis with graphs, comparison tables, circular infographics, and segmented diagrams.
    16 slides
    Hazard analysis slide deck flowchart with seven color-coded steps from establishing parameters to documenting results.
    257 views
    20 Downloads
    Get Custom Slides by Experts
    Enhance Your Presentations with Add-ins
    Google Slides Add-in
    Access templates directly in Google Slides
    Microsoft PowerPoint Add-in
    Access templates directly in PowerPoint
    GPT Add-on
    AI-powered presentation assistance

    Analytics PowerPoint Template — PowerPoint and Google Slides Template


    Spending hours building slides from scratch is time you don't have. A ready-made, fully editable template gets you to a polished presentation in minutes — not hours.


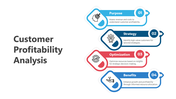
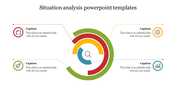
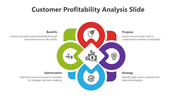
    This analytics powerpoint template gives you a clean, fully editable presentation slide that's ready to use the moment you download it. The slide features slide with three green sections in a vertical layout, each featuring icons for traffic, behavior tracking, and optimization. It's structured around a 3-part visual framework — giving your audience a clear, logical sequence to follow. Drop it into your deck, replace the placeholder text, and you're done.


    What's Inside


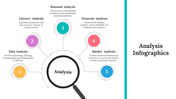
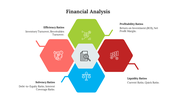
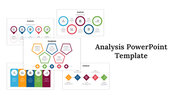
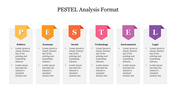
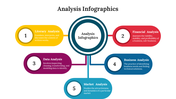
    A focused single-slide design — built for one strong visual message, fast to customize — text, colors, icons, and layout are all yours to adjust. Design variations include: Analytics, Web Analytics, Web Analytics Infographic, Web Analytics Uses. Match your brand, adapt the layout, change the colors — it takes minutes, not hours.


    Who This Is For


    Built for professionals, students, educators, and anyone who needs a polished, ready-to-use presentation template. No design background needed — just open, edit, and present.


    Formats & Download


    Available for PowerPoint and Google Slides. Download instantly — no design skills required. Everything is fully customizable to match your brand or topic.


    Key Features


    • Fully editable — text, colors, icons, and layout
    • Compatible with PowerPoint and Google Slides
    • 16:9 widescreen format — presentation-ready
    • Clean, professional design — no clutter
    • Premium — instant download access

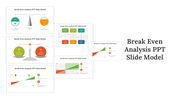
    Explore more Analysis PPT templates to find the right fit for your next presentation.

    Advertisement

    You May Also Like These PowerPoint Templates

    Add to Wishlist
    Download
    AI Customize
    SWOT diagram with curved arrows in blue, purple, orange, and yellow, pointing to each quadrant.
    Add to Wishlist
    Download
    AI Customize
    Observation slide with five pointers featuring icon like magnifying glass, eye, and face, each labeled and paired with  text.
    Add to Wishlist
    Download
    AI Customize
    Analysis themed PowerPoint template with a colorful magnifying glass, document icon, and sections for captions.
    Add to Wishlist
    Download
    AI Customize
    Situational analysis slide, with color coded sections in orange, green, yellow, and blue, for external, internal, and issues.
    Add to Wishlist
    Download
    AI Customize
    Infographic showing seven-step performance cycle in a circular layout, each step marked with colored numbers and labels.
    Add to Wishlist
    Download
    AI Customize
    Magnifying glass with two speech bubbles on the left and four colored analysis sections with checkmark icons on the right.
    Add to Wishlist
    Download
    AI Customize
    Analytics PowerPoint slide with colorful bar charts, including icons for graphs, data analysis, and business targets.
    Add to Wishlist
    Download
    AI Customize
    Data analytics template with a magnifying glass in the center and six purple icons arranged around it.
    Add to Wishlist
    Download
    AI Customize
    Slide deck focusing on macro environment factors, using circular charts and colorful blocks for clarity.
    Add to Wishlist
    Download
    AI Customize
    A slide showing the colorful MOSCOW method for project priorities with each category labeled and described on a white theme.
    Add to Wishlist
    Download
    AI Customize
    Red and black diagram with a magnifying glass focusing on three analysis sections with icons inside.
    Add to Wishlist
    Download
    AI Customize
    Market analysis PowerPoint template featuring six percentage milestones from 30 to 90 with corresponding captions.
    Add to Wishlist
    Download
    AI Customize
    Market analysis infographic with a yellow open box at the bottom, connected to four colored captions labeled 1 to 4.
    Add to Wishlist
    Download
    AI Customize
    A PPT slide showcasing a business analytics theme with icons for analysis, data, and insights, surrounded by six captions.
    Add to Wishlist
    Download
    AI Customize
    Business analysis slide showcasing steps with icons around a central illustration with a text description.
    Add to Wishlist
    Download
    AI Customize
    Radial diagram of Porter’s 5 Forces with percentages and labels around a central white circle marked Competitive Rivalry.
    Add to Wishlist
    Download
    AI Customize
    Dark themed slide featuring analytics elements, including a magnifying glass, mobile device, and percentages in bold.