Find our Collection of Analysis PPT and Google Slides Template

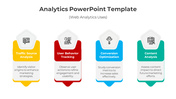


Analysis PowerPoint Template
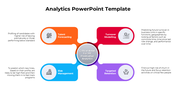
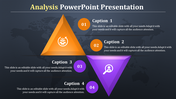
Uncover the involvement of market analysis effortlessly with our innovative Analysis PowerPoint Template. The dynamic slide is your gateway to comprehensive demographic insights. It is efficiently segmented into male and female populations. The sections gracefully ascend to reveal a visual representation of market trends and preferences. Each demographic is scored out of 10 to offer a quantitative measure for a more nuanced understanding.
Dedicated spaces for captions empower you to tailor the narrative. Suitable for marketing strategists, business analysts and researchers. An ideal template for evaluating consumer behavior, conducting gender-specific market research and outlining marketing strategies. Download today to deliver impactful market insights.
Features of the template
- The slide contains 16:9 and 4:3 formats.
- Compatible with Google Slides Themes and PowerPoint.
- 100% customizable slides and easy to download.
- It is easy to change the colors of the slide quickly.
- Well-crafted template with an instant download facility.


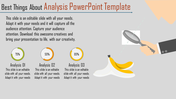
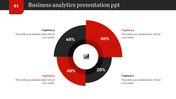
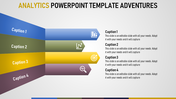
You May Also Like These PowerPoint Templates
Add to Wishlist
Download
Edit

Add to Wishlist
Download
Edit

Add to Wishlist
Download
Edit

Add to Wishlist
Download
Edit


Add to Wishlist
Download
Edit

Add to Wishlist
Download
Edit

Add to Wishlist
Download
Edit

Add to Wishlist
Download
Edit

Add to Wishlist
Download
Edit

Add to Wishlist
Download
Edit

Add to Wishlist
Download
Edit

Add to Wishlist
Download
Edit

Add to Wishlist
Download
Edit

Add to Wishlist
Download
Edit

Add to Wishlist
Download
Edit

Add to Wishlist
Download
Edit

Add to Wishlist
Download
Edit
