Demographics PowerPoint Presentation and Google Slides

Pack of 13 slides
P.ID : 44201
Advertisement
2.3K+ views
440 Downloads
Get Custom Slides by Experts
Instantly Access Templates in PowerPoint

Demographics Presentation Slides

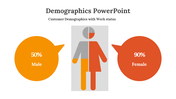
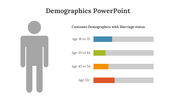
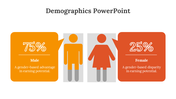
Demographics refer to statistical data that describes a population based on various characteristics such as age, gender, income, education, and geographic location. Understanding demographics is crucial for businesses to identify and target their ideal customer segments effectively. By leveraging demographic information, businesses can tailor their marketing strategies, product offerings, and communication channels to better engage and connect with their target audience. Let's utilize the demographics template to gain valuable insights and drive informed business decisions.

Features of the templates:

  • 100% customizable slides and easy to download.
  • Slides are available in different nodes & colors.
  • The slide contains 16:9 and 4:3 formats.
  • Easy to change the colors of the slide quickly.
  • Highly compatible with PowerPoint and Google Slides.
  • Well-crafted template with an instant download facility.

You May Also Like These PowerPoint Templates

Add to Wishlist
Download
AI Customize
Download Demography Slide Template Design Presentation
Add to Wishlist
Download
AI Customize
Illustration of purple male and orange female, by a row of icons indicating the number of individuals, with text areas.
Add to Wishlist
Download
AI Customize
Demographic comparison PowerPoint slide showing a male figure with 60  in red and a female figure with 40 percent in green.
Add to Wishlist
Download
AI Customize
Best Demographics PowerPoint And Google Slides Templates
Add to Wishlist
Download
AI Customize
Download Free Demographics PPT Template and Google Slides
Add to Wishlist
Download
AI Customize
World map comparison slide with regional demographics showing 80% female and 20% male distribution across continents.
Add to Wishlist
Download
AI Customize
Demographic comparison of male and female data in pink and yellow bars for different age categories.
Add to Wishlist
Download
AI Customize
An infographic showing survey evaluations from July to October 2023, with icons representing the number of respondents.
Add to Wishlist
Download
AI Customize
Infographic showing demographic data with colorful circular pie charts, text boxes, and colored figures in purple and red.
Free
Add to Wishlist
Download
AI Customize
 Demographic Segmentation PPT Template & Google Slides
Add to Wishlist
Download
AI Customize
Infographic showing demographic data in a PowerPoint slide with red and blue figures with placeholder text.
Free
Add to Wishlist
Download
AI Customize
Slide displaying gender demographics with a male in green and a female in red representation with percentages.
Add to Wishlist
Download
AI Customize
Demographic themed slides with various charts and icons to visualize population statistics, including male and female ratios.
Add to Wishlist
Download
AI Customize
Demographic comparison slide with red male and blue female icon, with percentage values and text areas below each.
Add to Wishlist
Download
AI Customize
Demographic infographic slide showing four rows of colored icons representing percentages with placeholder text.
Add to Wishlist
Download
AI Customize
Demographic slide with a bar chart, a segmented human icon, and four descriptive boxes to the right.
Add to Wishlist
Download
AI Customize
Demographic PowerPoint slide showing population data across four years with different colored icons representing percentages.
Add to Wishlist
Download
AI Customize
Survey result visualization showing 60% male and 40% female voting intention, displayed with person icons and a chart.
Add to Wishlist
Download
AI Customize
Chart with blue and orange bars representing male and female demographics, along with icons for each gender.
Add to Wishlist
Download
AI Customize
Demography PowerPoint template showcasing percentages with colored figures representing data and placeholder text.
Free
Add to Wishlist
Download
AI Customize
Market segmentation template with two sections, each featuring a row of figures representing in various colors.
Add to Wishlist
Download
AI Customize
Survey results template featuring percentages and icons, with 80% represented visually in a red block on the right.
Add to Wishlist
Download
AI Customize
Demographic layout with colored person icons in red and blue, linked with captions and percentage values.
Add to Wishlist
Download
AI Customize
Demographic business strategy infographic slide featuring seven key business areas and an icon representing growth.
Add to Wishlist
Download
AI Customize
Slide showing demographic statistics with orange and pink person icons on either side of a gray shield graphic.
Add to Wishlist
Download
AI Customize
Slide comparing two demographic segments, A and B, with gender icons and corresponding bar charts for three steps.
Add to Wishlist
Download
AI Customize
Layout showing blue and red blocks with percentages, a central figure, and step circles for demographic data visualization.
Add to Wishlist
Download
AI Customize
Demographic PPT presentation slide with four colorful circular sections labeled A, B, C, and D, each with placeholder text.