Customized Demographics PowerPoint Presentation Template

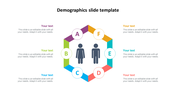

Demographics Presentation Template
Understanding and presenting demographic data is crucial for any business or academic project. Our Demographics PowerPoint Template offers a sophisticated and visually appealing solution to showcase this vital information effectively.
Slide Description:
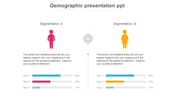
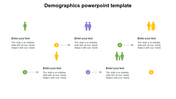
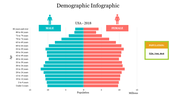
Our template features two sections: On the left, there’s a graphical representation of demographic data. On the right, there’s descriptive text. The graph displays age groups (ranging from “15-19” to “65-69”) with corresponding horizontal bars. The bars are in blue for males and red for females, indicating population distribution by gender and age.
Purpose of the Slide:
This slide serves as an editable template for presentations. It captures attention by visually presenting demographic data. Users can customize it to suit their specific information needs.
Who can benefit?
Marketers, researchers, sociologists, and anyone presenting population statistics. It’s useful for those who want to showcase demographic information engagingly.
Download our templates today and create compelling presentations that captivate and inform your audience.
Features of the template:
- Slides are available in 4:3 & 16:9
- Get slides that are 100% customizable and easy to download
- Highly compatible with PowerPoint and Google Slides


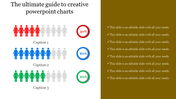
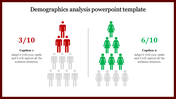
You May Also Like These PowerPoint Templates
Add to Wishlist
Download
Edit

Add to Wishlist
Download
Edit

Add to Wishlist
Download
Edit

Add to Wishlist
Download
Edit

Add to Wishlist
Download
Edit

Add to Wishlist
Download
Edit

Add to Wishlist
Download
Edit

Add to Wishlist
Download
Edit

Add to Wishlist
Download
Edit

Add to Wishlist
Download
Edit

Add to Wishlist
Download
Edit


Add to Wishlist
Download
Edit


Add to Wishlist
Download
Edit

Add to Wishlist
Download
Edit

Add to Wishlist
Download
Edit

Add to Wishlist
Download
Edit

Add to Wishlist
Download
Edit

Add to Wishlist
Download
Edit
