Demographics PowerPoint Template Presentation-Two Node

Illustration of purple male and orange female, by a row of icons indicating the number of individuals, with text areas.
P.ID : 44146
    708 views
    111 Downloads
    Get Custom Slides by Experts
    Instantly Access Templates in PowerPoint

    Demographics PPT Template 

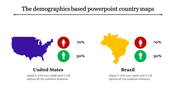
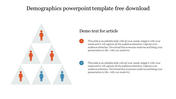
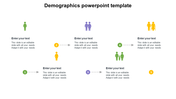
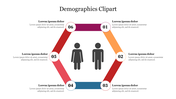
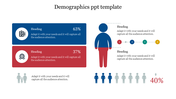
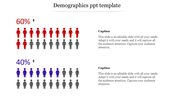
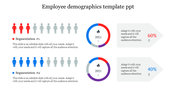
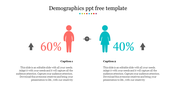
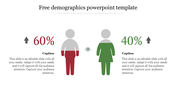
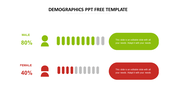
    We've got the slides if you've got the demographics data! Our slides are made to assist you in making sure that your audience gets what they came for. It's more than a PPT; it's an interactive show that will have your audience paying attention to every nook and cranny of the slide. Those two nodes with human icons and a capacious text area are uniquely made to depict your data precisely. How can you miss those violet and red hues which add elegance to your PPT? Also, don't miss this whole bunch of bonanzas. Download it soon.

    Features of the template:

    • 100% customizable slides and easy to download.
    • Slides are available in different nodes & colors.
    • The slide contained 16:9 and 4:3 formats.
    • Easy to change the slide colors quickly.
    • Well-crafted template with an instant download facility.
    • Amiable edit elements.
    Advertisement

    You May Also Like These PowerPoint Templates

    Add to Wishlist
    Download
    AI Customize
    Demographic infographic slide showing four rows of colored icons representing percentages with placeholder text.
    Add to Wishlist
    Download
    AI Customize
    Demographic slide with a bar chart, a segmented human icon, and four descriptive boxes to the right.
    Add to Wishlist
    Download
    AI Customize
    Demographic PowerPoint slide showing population data across four years with different colored icons representing percentages.
    Add to Wishlist
    Download
    AI Customize
    Survey result visualization showing 60% male and 40% female voting intention, displayed with person icons and a chart.
    Add to Wishlist
    Download
    AI Customize
    Chart with blue and orange bars representing male and female demographics, along with icons for each gender.
    Add to Wishlist
    Download
    AI Customize
    Demography PowerPoint template showcasing percentages with colored figures representing data and placeholder text.
    Free
    Add to Wishlist
    Download
    AI Customize
    Market segmentation template with two sections, each featuring a row of figures representing in various colors.
    Add to Wishlist
    Download
    AI Customize
    Survey results template featuring percentages and icons, with 80% represented visually in a red block on the right.
    Add to Wishlist
    Download
    AI Customize
    Demographic layout with colored person icons in red and blue, linked with captions and percentage values.
    Add to Wishlist
    Download
    AI Customize
    Demographic business strategy infographic slide featuring seven key business areas and an icon representing growth.
    Add to Wishlist
    Download
    AI Customize
    Slide showing demographic statistics with orange and pink person icons on either side of a gray shield graphic.
    Add to Wishlist
    Download
    AI Customize
    Slide comparing two demographic segments, A and B, with gender icons and corresponding bar charts for three steps.
    Add to Wishlist
    Download
    AI Customize
    Layout showing blue and red blocks with percentages, a central figure, and step circles for demographic data visualization.
    Add to Wishlist
    Download
    AI Customize
    Demographic PPT presentation slide with four colorful circular sections labeled A, B, C, and D, each with placeholder text.
    Add to Wishlist
    Download
    AI Customize
    Demographics PowerPoint Template Presentation Slide
    Add to Wishlist
    Download
    AI Customize
    Demographic infographic displaying the population of the USA in 2018 by age group and gender, with male and female sections.
    Add to Wishlist
    Download
    AI Customize
    Hexagonal diagram with six colored sections, featuring male and female icons, with numbered labels and captions.