Free - Creative Demographics PPT Template With Colorful Nodes

Free
Slide displaying gender demographics with a male in green and a female in red representation with percentages.
P.ID : 49174
    1.2K+ views
    473 Downloads
    Get Custom Slides by Experts
    Instantly Access Templates in PowerPoint

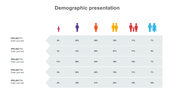
    Simple Demographics Template

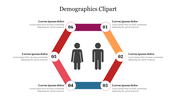
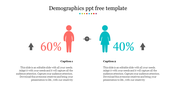
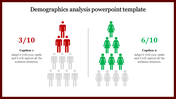
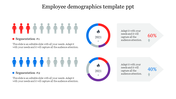
    Demographics is the analytic study of a population based on age, race, and sex. Create statistical presentations with our Elegant Demographics Themed Presentation Template. It is handy to educate your audience about population and related facts. The two nodes of this slide are built with large text space, percentage, and level indicators. They are contrasted with green and red colors. It allows you to add your marketing, business, political, economic, and statistics data. You can alter the text, style, design, and colors to your desired taste. Download this template for quick demographic PPTs.

    Features of the template

    • 100% customizable slides and easy to download.
    • Slides are available in different nodes & colors.
    • The slide contained 16:9 and 4:3 formats.
    • Easy to change the slide colors quickly.
    • Well-crafted template with instant download facility.
    • Two nodes space with dual shades.
    • Huge and bold text format added.
    Advertisement

    You May Also Like These PowerPoint Templates

    Add to Wishlist
    Download
    AI Customize
    World map comparison slide with regional demographics showing 80% female and 20% male distribution across continents.
    Add to Wishlist
    Download
    AI Customize
    Demographic comparison of male and female data in pink and yellow bars for different age categories.
    Add to Wishlist
    Download
    AI Customize
    An infographic showing survey evaluations from July to October 2023, with icons representing the number of respondents.
    Add to Wishlist
    Download
    AI Customize
    Infographic showing demographic data with colorful circular pie charts, text boxes, and colored figures in purple and red.
    Free
    Add to Wishlist
    Download
    AI Customize
     Demographic Segmentation PPT Template & Google Slides
    Add to Wishlist
    Download
    AI Customize
    Infographic showing demographic data in a PowerPoint slide with red and blue figures with placeholder text.
    Free
    Add to Wishlist
    Download
    AI Customize
    Slide displaying gender demographics with a male in green and a female in red representation with percentages.
    Add to Wishlist
    Download
    AI Customize
    Demographic themed slides with various charts and icons to visualize population statistics, including male and female ratios.
    Add to Wishlist
    Download
    AI Customize
    Demographic comparison slide with red male and blue female icon, with percentage values and text areas below each.
    Add to Wishlist
    Download
    AI Customize
    Demographic infographic slide showing four rows of colored icons representing percentages with placeholder text.
    Add to Wishlist
    Download
    AI Customize
    Demographic slide with a bar chart, a segmented human icon, and four descriptive boxes to the right.
    Add to Wishlist
    Download
    AI Customize
    Demographic PowerPoint slide showing population data across four years with different colored icons representing percentages.
    Add to Wishlist
    Download
    AI Customize
    Survey result visualization showing 60% male and 40% female voting intention, displayed with person icons and a chart.
    Add to Wishlist
    Download
    AI Customize
    Chart with blue and orange bars representing male and female demographics, along with icons for each gender.
    Add to Wishlist
    Download
    AI Customize
    Demography PowerPoint template showcasing percentages with colored figures representing data and placeholder text.
    Free
    Add to Wishlist
    Download
    AI Customize
    Market segmentation template with two sections, each featuring a row of figures representing in various colors.