Multinode Survey Findings PowerPoint Presentation Template

Three-section layout with purple, green, and red banners summarizing survey objectives with placeholder boxes.
P.ID : 54396
    916 views
    113 Downloads
    Get Custom Slides by Experts
    Instantly Access Templates in PowerPoint

    Creative Market Survey Findings PPT Template 


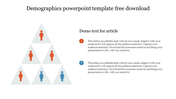
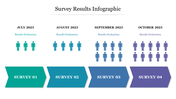
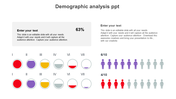
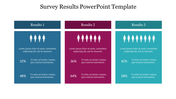
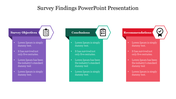
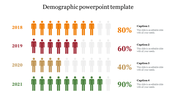
    Get our Survey Findings PowerPoint Presentation Slide to make excellent presentations on any Market case Study. This Survey template is made of brilliant design to engage the audience. It is a pre-built slide with all the essential stock market Survey elements you need. About the design of the slides, It has three hexagonal icons with text boxes. In addition, this Survey Findings PowerPoint Presentation Slide has three icons with text areas in which users can add their Survey data. In addition, We also have a wide range of slides for Stock Market Case Study PPT templates. Our templates are 100% editable.

    Feature of this template

    1.100% Customizable (shape color, size & text)
    2.This template has a Colorful theme, and you can also choose the color
    3.Huge Collections of Market slides to impress your audience
    4.This Market slide supports 16:9 and 4:3.
    5.Easily readable and acceptable template.
    Advertisement

    You May Also Like These PowerPoint Templates

    Add to Wishlist
    Download
    AI Customize
    Survey result visualization showing 60% male and 40% female voting intention, displayed with person icons and a chart.
    Add to Wishlist
    Download
    AI Customize
    Chart with blue and orange bars representing male and female demographics, along with icons for each gender.
    Add to Wishlist
    Download
    AI Customize
    Demography PowerPoint template showcasing percentages with colored figures representing data and placeholder text.
    Free
    Add to Wishlist
    Download
    AI Customize
    Market segmentation template with two sections, each featuring a row of figures representing in various colors.
    Add to Wishlist
    Download
    AI Customize
    Survey results template featuring percentages and icons, with 80% represented visually in a red block on the right.
    Add to Wishlist
    Download
    AI Customize
    Demographic layout with colored person icons in red and blue, linked with captions and percentage values.
    Add to Wishlist
    Download
    AI Customize
    Demographic business strategy infographic slide featuring seven key business areas and an icon representing growth.
    Add to Wishlist
    Download
    AI Customize
    Slide showing demographic statistics with orange and pink person icons on either side of a gray shield graphic.
    Add to Wishlist
    Download
    AI Customize
    Slide comparing two demographic segments, A and B, with gender icons and corresponding bar charts for three steps.
    Add to Wishlist
    Download
    AI Customize
    Layout showing blue and red blocks with percentages, a central figure, and step circles for demographic data visualization.
    Add to Wishlist
    Download
    AI Customize
    Demographic PPT presentation slide with four colorful circular sections labeled A, B, C, and D, each with placeholder text.
    Add to Wishlist
    Download
    AI Customize
    Demographics PowerPoint Template Presentation Slide
    Add to Wishlist
    Download
    AI Customize
    Hexagonal diagram with six colored sections, featuring male and female icons, with numbered labels and captions.
    Add to Wishlist
    Download
    AI Customize
    Demographic infographic displaying the population of the USA in 2018 by age group and gender, with male and female sections.
    Add to Wishlist
    Download
    AI Customize
    Demographics based PPT slide featuring maps of the United States and Brazil with gender distribution icons and percentages.
    Add to Wishlist
    Download
    AI Customize
    Grab dazzling Demographics PPT Free Template presentation
    Add to Wishlist
    Download
    AI Customize
    Slide with three colorful human icons representing proportions, with circular percentages and text on the brown sidebar.