Demographic Infographic PowerPoint and Google Slides

Demographic comparison of male and female data in pink and yellow bars for different age categories.
P.ID : 44150
    1.7K+ views
    177 Downloads
    Get Custom Slides by Experts
    Instantly Access Templates in PowerPoint

    Demographic Infographic Presentation Slide

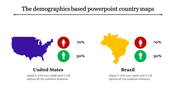
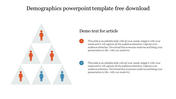
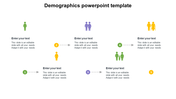
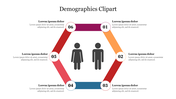
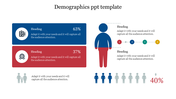
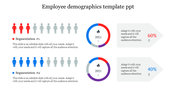
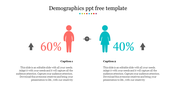
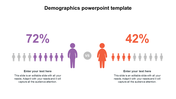
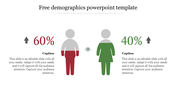
    Knowing your audience is crucial for any business, and demographics play a big role in shaping their preferences and behavior. Demographics are all about the stats that describe a population, like age, gender, race, income, education, and job. It's super important for businesses, governments, and orgs to make smart choices and customize their stuff to meet the needs of their peeps. Our ready-to-go demographics template has slick infographics and charts to help you show off and analyze demographic data for any purpose.

    Features of the template

    • 100% customizable slides and easy to download.
    • Slides are available in different nodes & colors.
    • The slide contains 16:9 and 4:3 formats.
    • Easy to change the colors of the slide quickly.
    • Well-crafted template with an instant download facility.
    • Highly compatible with PowerPoint and Google Slides.
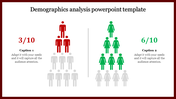
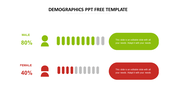
    • Simple slide to compare demographics.
    • Easily understandable layout.
    Advertisement

    You May Also Like These PowerPoint Templates

    Add to Wishlist
    Download
    AI Customize
    Demography PowerPoint template showcasing percentages with colored figures representing data and placeholder text.
    Free
    Add to Wishlist
    Download
    AI Customize
    Market segmentation template with two sections, each featuring a row of figures representing in various colors.
    Add to Wishlist
    Download
    AI Customize
    Demographic layout with colored person icons in red and blue, linked with captions and percentage values.
    Add to Wishlist
    Download
    AI Customize
    Demographic business strategy infographic slide featuring seven key business areas and an icon representing growth.
    Add to Wishlist
    Download
    AI Customize
    Slide showing demographic statistics with orange and pink person icons on either side of a gray shield graphic.
    Add to Wishlist
    Download
    AI Customize
    Slide comparing two demographic segments, A and B, with gender icons and corresponding bar charts for three steps.
    Add to Wishlist
    Download
    AI Customize
    Layout showing blue and red blocks with percentages, a central figure, and step circles for demographic data visualization.
    Add to Wishlist
    Download
    AI Customize
    Demographic PPT presentation slide with four colorful circular sections labeled A, B, C, and D, each with placeholder text.
    Add to Wishlist
    Download
    AI Customize
    PPT slide displaying 2 waffle charts with percentages and person icons, showing data in green and white theme with captions.
    Add to Wishlist
    Download
    AI Customize
    Demographics PowerPoint Template Presentation Slide
    Add to Wishlist
    Download
    AI Customize
    Demographic infographic displaying the population of the USA in 2018 by age group and gender, with male and female sections.
    Add to Wishlist
    Download
    AI Customize
    Hexagonal diagram with six colored sections, featuring male and female icons, with numbered labels and captions.
    Add to Wishlist
    Download
    AI Customize
    Grab dazzling Demographics PPT Free Template presentation
    Add to Wishlist
    Download
    AI Customize
    Slide with three colorful human icons representing proportions, with circular percentages and text on the brown sidebar.
    Add to Wishlist
    Download
    AI Customize
    Download Demography Slide Template Design Presentation
    Add to Wishlist
    Download
    AI Customize
    Illustration of purple male and orange female, by a row of icons indicating the number of individuals, with text areas.