MILESTONE 🌟 5 Million+ creative minds trust SlideEgg! Grab 80% OFF

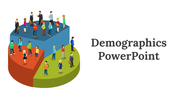
Demographics PowerPoint Template Presentation Slide

Demographic icons showing a man, woman, couple, family, and elderly pair with markers and placeholder text beside each.
P.ID : 44148
    473 views
    47 Downloads
    Get Custom Slides by Experts
    Instantly Access Templates in PowerPoint

    PPT for Demographic Data

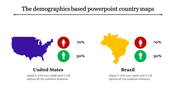
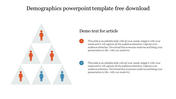
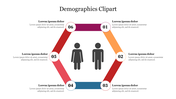
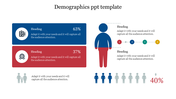
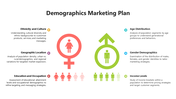
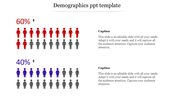
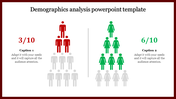
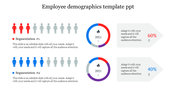
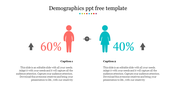
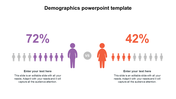
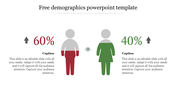
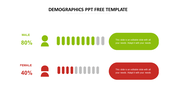
    Now, you can present a few key facts related to demographics with our PPT slides. Our slide is devised to help you get your point across. It will help your audience comprehend the numbers and findings of your analysis. With our demographic Presentation Slide, you can get your point across more quickly and convey the message from your data! You can flaunt your facts in detail with the five nodes and human icons. They'll make all the complicated stuff clear and even a little fun. It's time to draft your exquisite PPTs.

    Features of the template:

    • 100% customizable slides and easy to download.
    • Slides are available in different nodes & colors.
    • The slide contained 16:9 and 4:3 formats.
    • Easy to change the slide colors quickly.
    • Well-crafted template with an instant download facility.
    • Spacious nodes arena.
    Advertisement

    You May Also Like These PowerPoint Templates

    Free
    Add to Wishlist
    Download
    AI Customize
    Slide displaying gender demographics with a male in green and a female in red representation with percentages.
    Add to Wishlist
    Download
    AI Customize
    Demographic themed slides with various charts and icons to visualize population statistics, including male and female ratios.
    Add to Wishlist
    Download
    AI Customize
    Two rows of gray box with male and female icons, colorful circular progress bars in the center, and text on the right.
    Add to Wishlist
    Download
    AI Customize
    Demographic comparison slide with red male and blue female icon, with percentage values and text areas below each.
    Add to Wishlist
    Download
    AI Customize
    Demographic infographic slide showing four rows of colored icons representing percentages with placeholder text.
    Add to Wishlist
    Download
    AI Customize
    Demographic slide with a bar chart, a segmented human icon, and four descriptive boxes to the right.
    Add to Wishlist
    Download
    AI Customize
    Demographic PowerPoint slide showing population data across four years with different colored icons representing percentages.
    Add to Wishlist
    Download
    AI Customize
    Survey result visualization showing 60% male and 40% female voting intention, displayed with person icons and a chart.
    Add to Wishlist
    Download
    AI Customize
    Chart with blue and orange bars representing male and female demographics, along with icons for each gender.
    Add to Wishlist
    Download
    AI Customize
    Demography PowerPoint template showcasing percentages with colored figures representing data and placeholder text.
    Free
    Add to Wishlist
    Download
    AI Customize
    Market segmentation template with two sections, each featuring a row of figures representing in various colors.
    Add to Wishlist
    Download
    AI Customize
    Survey results template featuring percentages and icons, with 80% represented visually in a red block on the right.
    Add to Wishlist
    Download
    AI Customize
    Demographic layout with colored person icons in red and blue, linked with captions and percentage values.
    Add to Wishlist
    Download
    AI Customize
    Demographic business strategy infographic slide featuring seven key business areas and an icon representing growth.
    Add to Wishlist
    Download
    AI Customize
    Slide showing demographic statistics with orange and pink person icons on either side of a gray shield graphic.
    Add to Wishlist
    Download
    AI Customize
    Slide comparing two demographic segments, A and B, with gender icons and corresponding bar charts for three steps.