Download Free Demographics PPT Template and Google Slides

Download Free Demographics PPT Template and Google Slides
P.ID : 44199
    36 slides
    Collection of people infographic slides with colorful charts, graphs, and illustrations representing various demographics.
    31 slides
    Best Demographics PowerPoint And Google Slides Templates
    13 slides
    Demographic themed slides with various charts and icons to visualize population statistics, including male and female ratios.
    3.4K+ views
    250 Downloads
    Get Custom Slides by Experts
    Instantly Access Templates in PowerPoint

    Download Free Demographics PowerPoint Template 

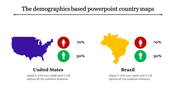
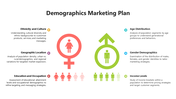
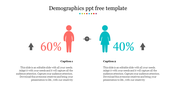
    Demographics are essential for understanding the characteristics of a population. It includes data such as age, gender, education, race, income level, and geographical region. You can use this data to target marketing efforts, measure the success of existing marketing campaigns, and inform decisions about product development and services. Furthermore, our free template helps you to illustrate the behaviors of a population and develop strategies to reach them.

    Features of the template.

    • 100% customizable slides and easy-to-download
    • Slides are available in different nodes & colors.
    • The slides contain 16:9 and 4:3 formats.
    • Easy to change the slide colors quickly.
    • It is a well-crafted template with an instant download facility.
    • We designed this slide with a stunning design.
    • You can use this in Microsoft PowerPoint.
    Advertisement

    You May Also Like These PowerPoint Templates

    Add to Wishlist
    Download
    AI Customize
    Demographic infographic slide showing four rows of colored icons representing percentages with placeholder text.
    Add to Wishlist
    Download
    AI Customize
    Demographic slide with a bar chart, a segmented human icon, and four descriptive boxes to the right.
    Add to Wishlist
    Download
    AI Customize
    Demographic PowerPoint slide showing population data across four years with different colored icons representing percentages.
    Add to Wishlist
    Download
    AI Customize
    Survey result visualization showing 60% male and 40% female voting intention, displayed with person icons and a chart.
    Add to Wishlist
    Download
    AI Customize
    Chart with blue and orange bars representing male and female demographics, along with icons for each gender.
    Add to Wishlist
    Download
    AI Customize
    Demography PowerPoint template showcasing percentages with colored figures representing data and placeholder text.
    Free
    Add to Wishlist
    Download
    AI Customize
    Market segmentation template with two sections, each featuring a row of figures representing in various colors.
    Add to Wishlist
    Download
    AI Customize
    Demographic layout with colored person icons in red and blue, linked with captions and percentage values.
    Add to Wishlist
    Download
    AI Customize
    Demographic business strategy infographic slide featuring seven key business areas and an icon representing growth.
    Add to Wishlist
    Download
    AI Customize
    Slide showing demographic statistics with orange and pink person icons on either side of a gray shield graphic.
    Add to Wishlist
    Download
    AI Customize
    Slide comparing two demographic segments, A and B, with gender icons and corresponding bar charts for three steps.
    Add to Wishlist
    Download
    AI Customize
    Layout showing blue and red blocks with percentages, a central figure, and step circles for demographic data visualization.
    Add to Wishlist
    Download
    AI Customize
    Demographic PPT presentation slide with four colorful circular sections labeled A, B, C, and D, each with placeholder text.
    Add to Wishlist
    Download
    AI Customize
    PPT slide displaying 2 waffle charts with percentages and person icons, showing data in green and white theme with captions.
    Add to Wishlist
    Download
    AI Customize
    Demographics PowerPoint Template Presentation Slide