Innovative Country Maps PowerPoint Template Design

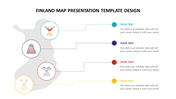
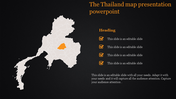
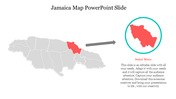
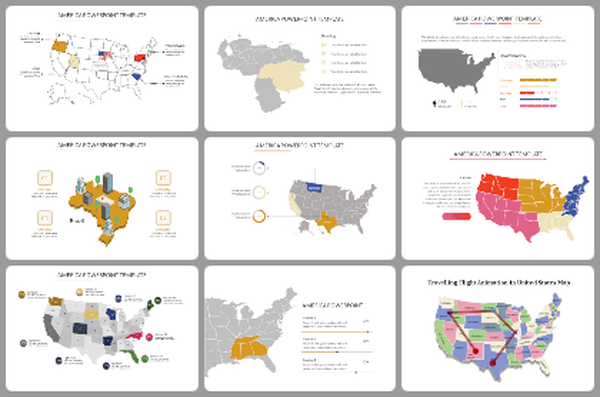
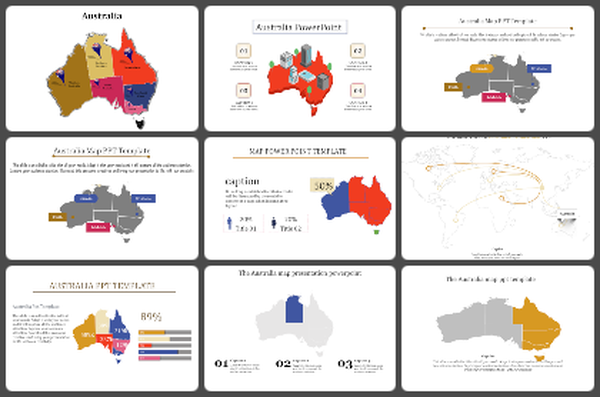
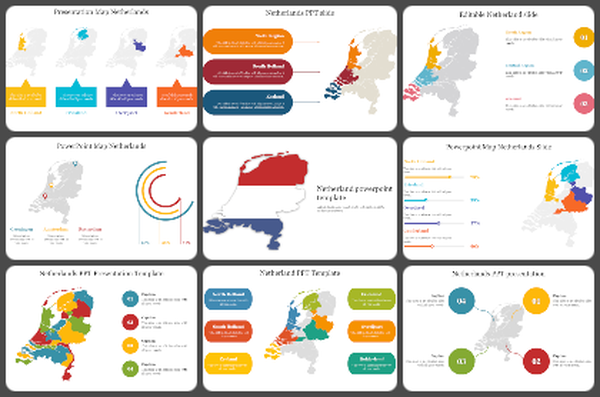
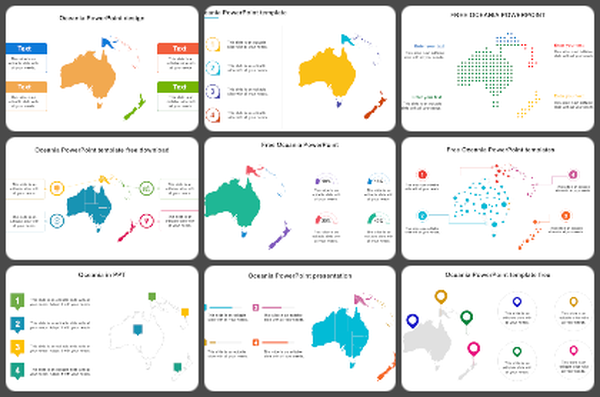
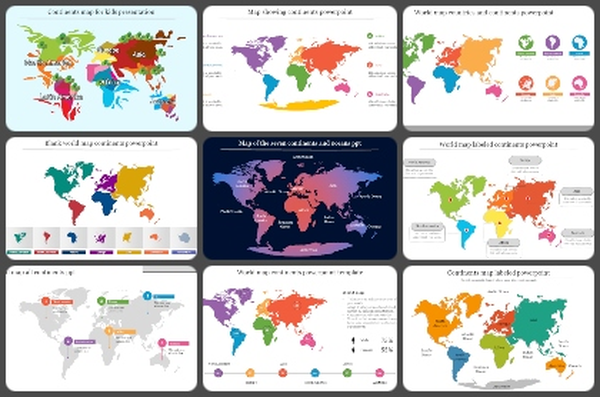
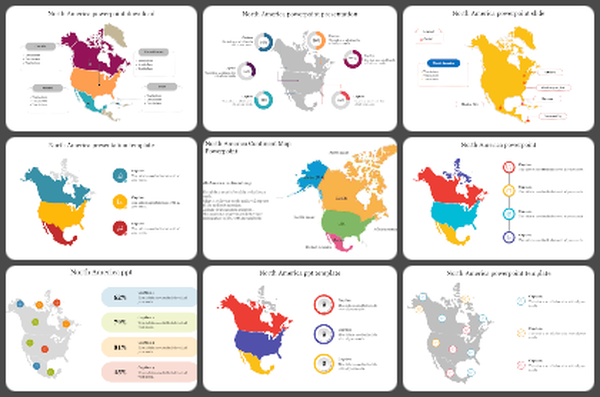
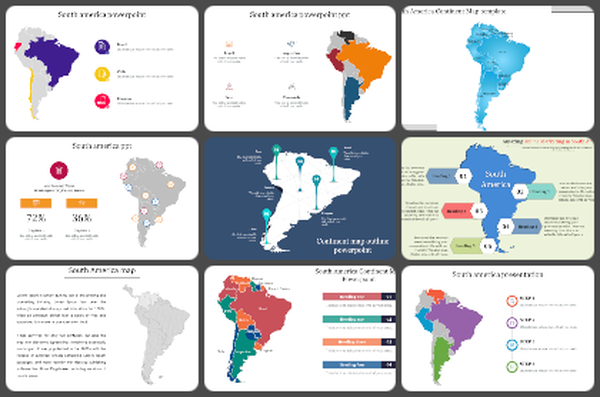
Country Map Presentation Template
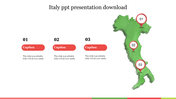
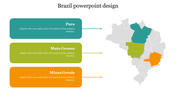
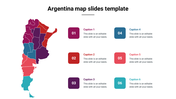
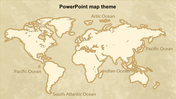
Captivate your audience with our Country map PowerPoint template. Our slide shows two beautifully designed maps: the United States and Brazil, each with a clear demographic map that immediately communicates key demographic information. The color-coded symbols are intuitive—red for 70% and green for 30%, allowing for complex information at a glance. Whether you’re showing market research, academic statistics, or geographical trends, these templates are your secret weapon.
Who can use these templates?
Marketers: Marketing analysts, marketers, and strategists can use these maps to project market segmentation, regional trends, and customer demographics.
Teachers and students: Teachers, professors, and students can enrich their geography or sociology presentations with interesting maps.
Researchers: Demographers, sociologists, and researchers can use these models to predict population distribution, migration patterns, and more.
Click now to download our American map PowerPoint template and turn complex data into amazing visual content that resonates with audiences everywhere.
Features of the template:
- Slides are available in 4:3 & 16:9
- Get slides that are 100% customizable and easy to download
- Highly compatible with PowerPoint and Google Slides.
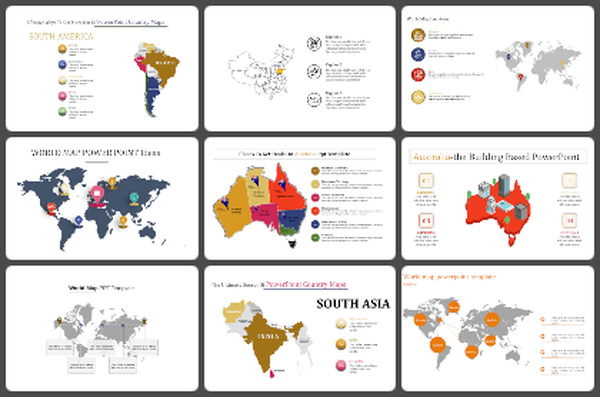
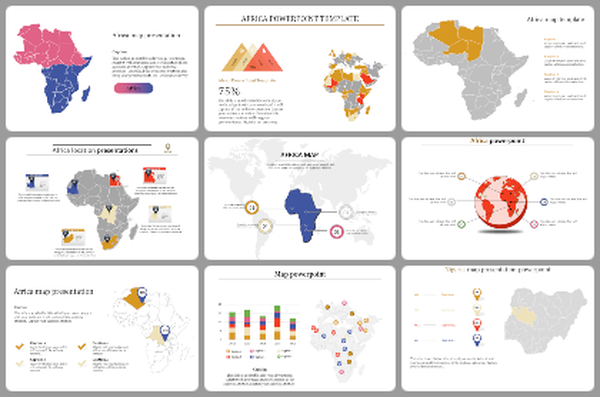
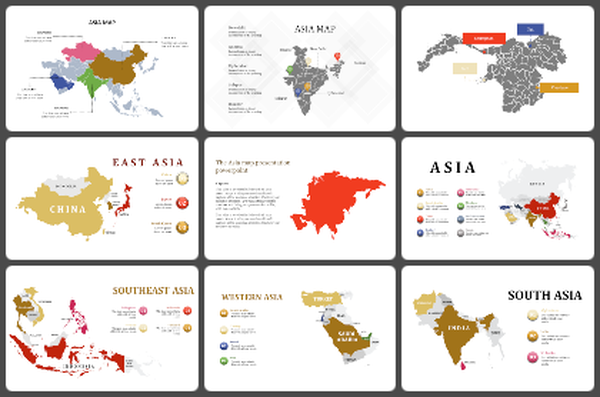
You May Also Like These PowerPoint Templates
Add to Wishlist
Download
Edit

Add to Wishlist
Download
Edit

Add to Wishlist
Download
Edit

Add to Wishlist
Download
Edit

Add to Wishlist
Download
Edit

Add to Wishlist
Download
Edit

Add to Wishlist
Download
Edit

Add to Wishlist
Download
Edit

Add to Wishlist
Download
Edit

Add to Wishlist
Download
Edit

Add to Wishlist
Download
Edit

Add to Wishlist
Download
Edit

Add to Wishlist
Download
Edit

Add to Wishlist
Download
Edit

Add to Wishlist
Download
Edit

Add to Wishlist
Download
Edit


Add to Wishlist
Download
Edit

Add to Wishlist
Download
Edit
Add to Wishlist
Download
Edit
