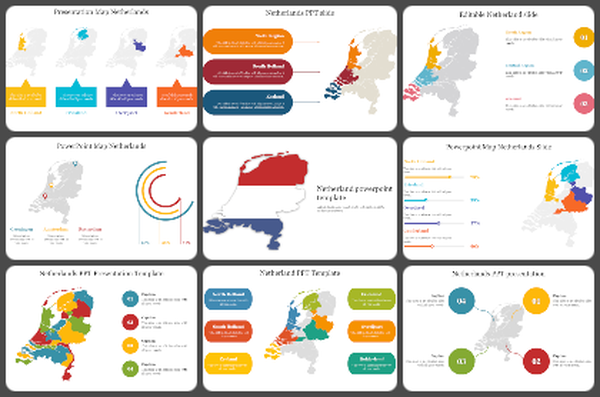
Editable Map Of Netherlands Infographics Presentation


Netherlands Maps Slide Deck
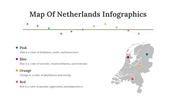
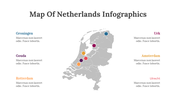
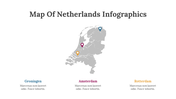
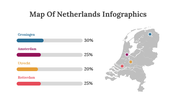
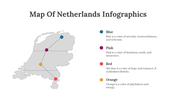
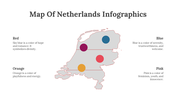
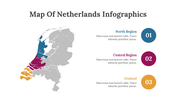
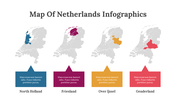
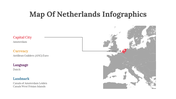
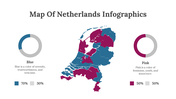
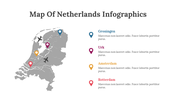
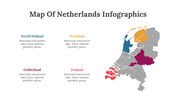
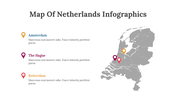
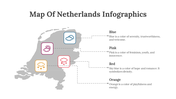
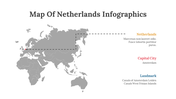
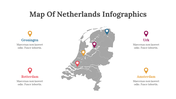
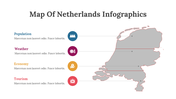
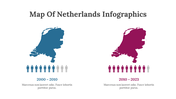
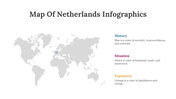
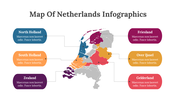
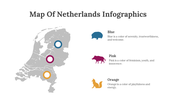
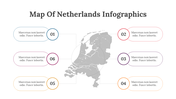
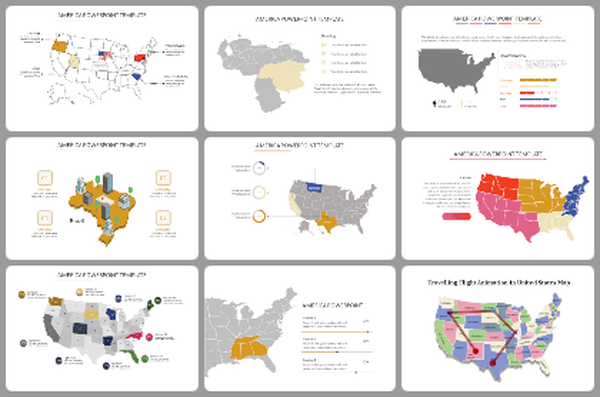
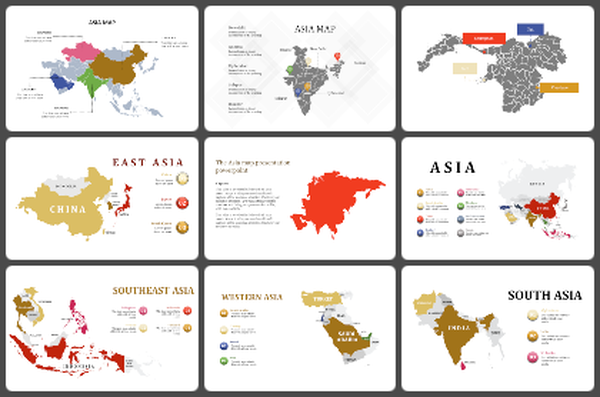
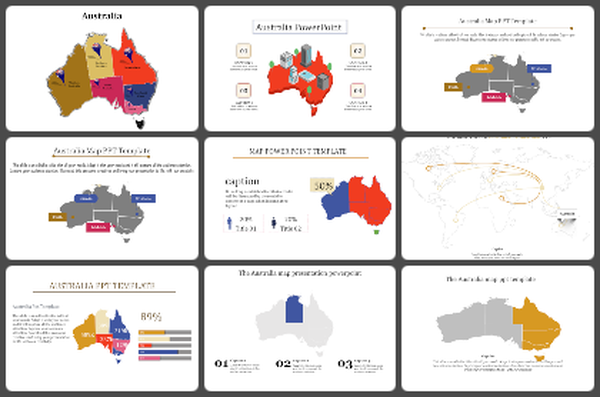
Get this editable Netherlands Map Infographics Template and Google Slides to make stunning presentations about the Netherlands. We offer this deck with 36 incredible slides to make your slide show astonishing. These slides are creatively made with a well-designed map of the Netherlands. You can use this deck to talk about this country, such as its capital, provinces, important locations, travel routes, regions, landmarks, currency, language, weather, population, tourism, etc. It has editable text boxes, graphs, and maps to enrich your presentation. So, why not try this deck?
Features of the template
- 100% customizable slides and easy to download.
- Slides are available in different nodes & colors.
- The slide contains 16:9 and 4:3 formats.
- Easy to change the colors of the slide quickly.
- Well-crafted template with an instant download facility.
- It includes editable maps.
You May Also Like These PowerPoint Templates
Add to Wishlist
Download
Edit

Add to Wishlist
Download
Edit

Add to Wishlist
Download
Edit

Add to Wishlist
Download
Edit

Add to Wishlist
Download
Edit

Add to Wishlist
Download
Edit

Add to Wishlist
Download
Edit


Add to Wishlist
Download
Edit

Add to Wishlist
Download
Edit

Add to Wishlist
Download
Edit

Add to Wishlist
Download
Edit

Add to Wishlist
Download
Edit

Add to Wishlist
Download
Edit

Add to Wishlist
Download
Edit

Add to Wishlist
Download
Edit

Add to Wishlist
Download
Edit


Add to Wishlist
Download
Edit

Add to Wishlist
Download
Edit

Add to Wishlist
Download
Edit

Add to Wishlist
Download
Edit


Add to Wishlist
Download
Edit

Add to Wishlist
Download
Edit


Add to Wishlist
Download
Edit

Add to Wishlist
Download
Edit


Add to Wishlist
Download
Edit

Add to Wishlist
Download
Edit

Add to Wishlist
Download
Edit

Add to Wishlist
Download
Edit

Add to Wishlist
Download
Edit

Add to Wishlist
Download
Edit

Add to Wishlist
Download
Edit
