Attractive Maps For PowerPoint Presentations Free Slide

World map with six colored location markers in teal, purple, pink, black, blue, and gold representing different regions.
P.ID : 45910
    102 views
    12 Downloads
    Get Custom Slides by Experts
    Instantly Access Templates in PowerPoint

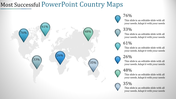
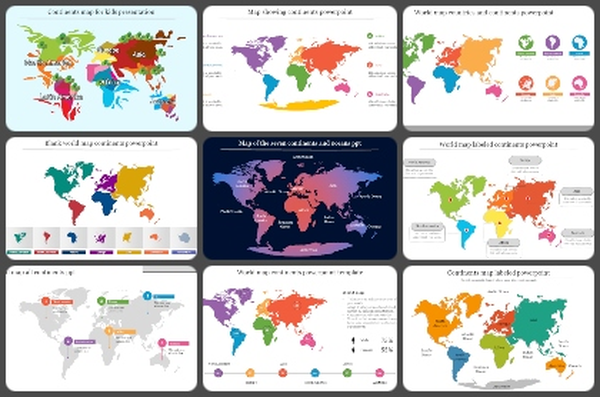
    Practical World Map For Any Presentation With Checkpoints


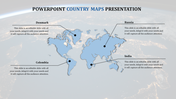
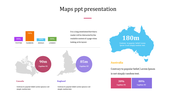
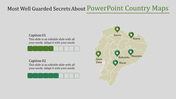
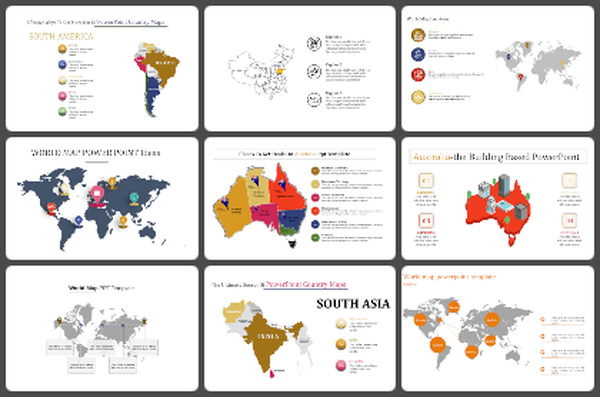
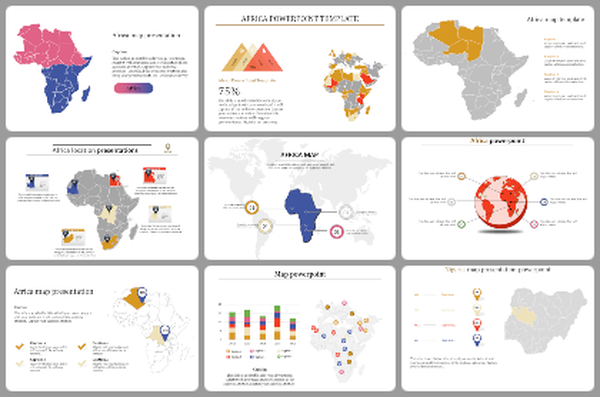
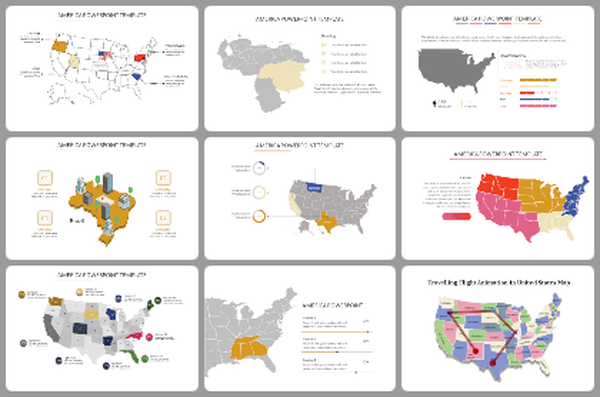
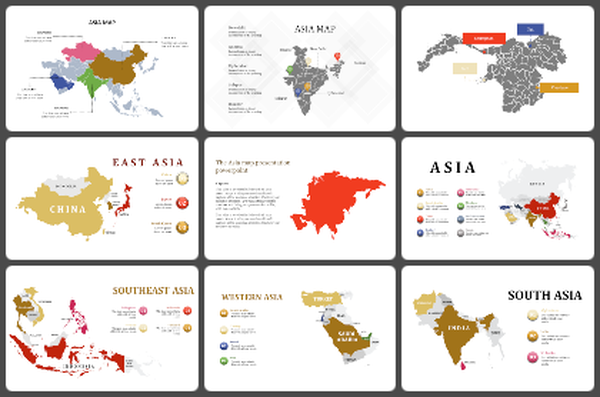
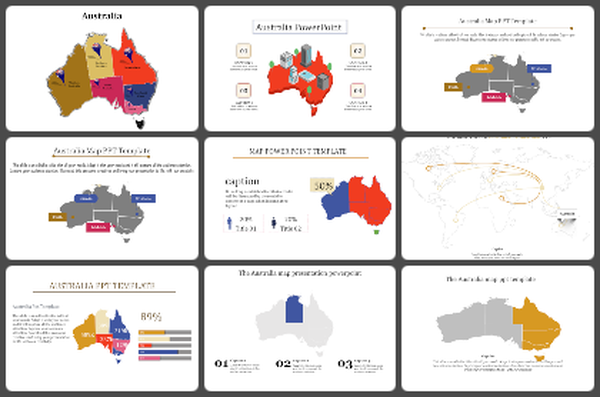
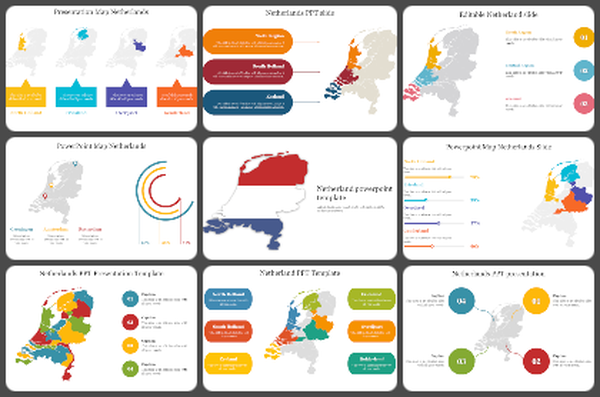
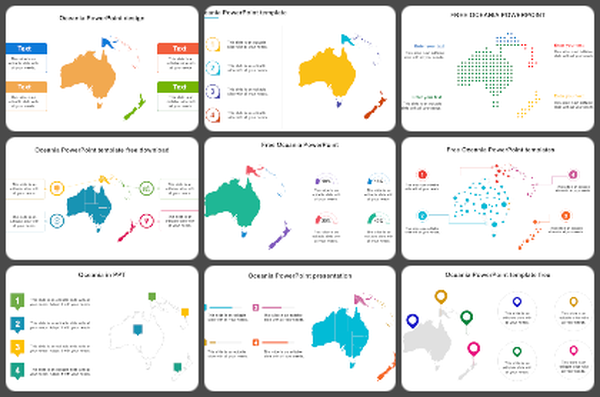
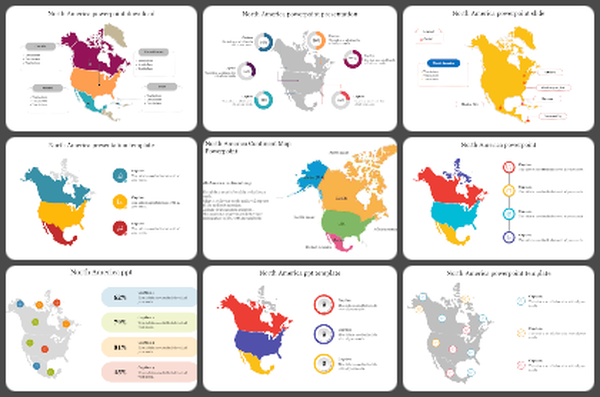
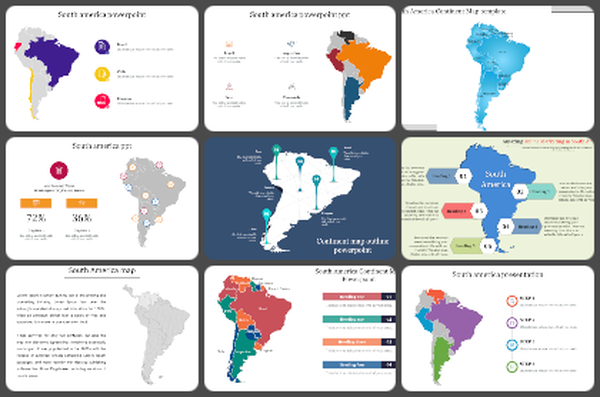
    Get our Maps For PowerPoint Presentations Free to provide a clear picture of the world Map. It is not so hard to make a better world map if you use our Maps For PowerPoint Presentations Free. You will also learn some tips while using our map template. Finally, you will be satisfied with the results that you will achieve. Every continent has a pinpoint and is highlighted in different shades. We have a lot of excellent slides for the World Map PPT template. You can choose between many colors in our templates. However, Users can change the fonts, the format of the Continent map, and the borders.

    Features of this template

    • 100% editable and easy to modify
    • Huge Collections of slides to impress your audience
    • Easy-to-edit graphics such as graphs, maps, tables, and timelines
    • Ready to use in Google Slides and Microsoft PowerPoint
    • 16:9 screen format suitable for all types of screens.
    Advertisement

    You May Also Like These PowerPoint Templates

    Add to Wishlist
    Download
    AI Customize
    World map PowerPoint slide showing global connections with curved arrows, highlighting China as a central hub.
    Add to Wishlist
    Download
    AI Customize
    World map with colored regions in blue, red, and purple, along with text descriptions pointing to each area.
    Add to Wishlist
    Download
    AI Customize
    Gray map of Japan highlighting key regions like tokyo, kanagawa, osaka, and aichi, with placeholder text for each location.
    Add to Wishlist
    Download
    AI Customize
    Map of the United Kingdom with a highlighted region and progress indicators with placeholder text on a dark backdrop.
    Add to Wishlist
    Download
    AI Customize
    Map presentation slide with a construction theme, featuring a world map and percentage indicators for different regions.
    Add to Wishlist
    Download
    AI Customize
    World map PPT template with colorful location markers and caption points with placeholder text.
    Add to Wishlist
    Download
    AI Customize
    Best slide design italy powerpoint
    Add to Wishlist
    Download
    AI Customize
    Slide featuring a world map with region data in colored dots, along with percentage stats and a bar chart for performance.
    Add to Wishlist
    Download
    AI Customize
    Map PowerPoint slide showing a world map with highlighted regions from North America to Australia.
    Add to Wishlist
    Download
    AI Customize
    USA map with five colored states inside a white circular frame, alongside text on a bright blue background.
    Add to Wishlist
    Download
    AI Customize
    Map Of Sweden Infographics PowerPoint Presentation
    Free
    Add to Wishlist
    Download
    AI Customize
    Best Free PowerPoint Map Templates Presentation Slide
    Add to Wishlist
    Download
    AI Customize
    PowerPoint template showing a world map with color coded regions and percentages with placeholder text.
    Add to Wishlist
    Download
    AI Customize
    Map of Western Asia highlighting Saudi Arabia, Turkey, Israel, and UAE in distinct colors with labeled captions areas.
    Free
    Add to Wishlist
    Download
    AI Customize
    PowerPoint template with a world map and icons representing cars, trucks, and buses, with placeholder text beside each icon.
    Add to Wishlist
    Download
    AI Customize
    Southern USA states highlighted in various colors with a legend listing states like Louisiana, Georgia, and Oklahoma.
    Add to Wishlist
    Download
    AI Customize
    World map with countries highlighted in different colors, each labeled with a country name in a text box.
    Add to Wishlist
    Download
    AI Customize
    USA map with three labeled states, connected to pie charts illustrating marketing distribution percentages.