Easy To Editable Map Of Mexico Infographics PowerPoint

Pack of 36 slides
P.ID : 69044
Advertisement
422 views
94 Downloads
Get Custom Slides by Experts
Instantly Access Templates in PowerPoint

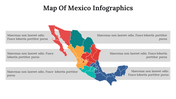
Stunning Mexico Infographics Slides

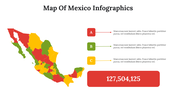
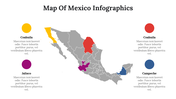
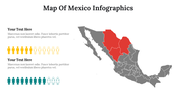
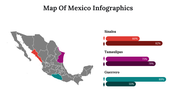
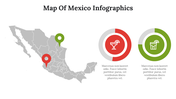
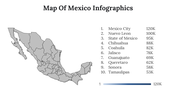
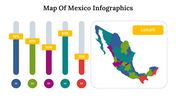
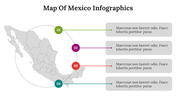
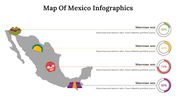
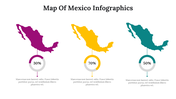
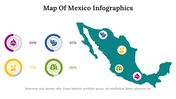
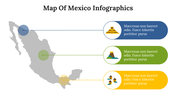
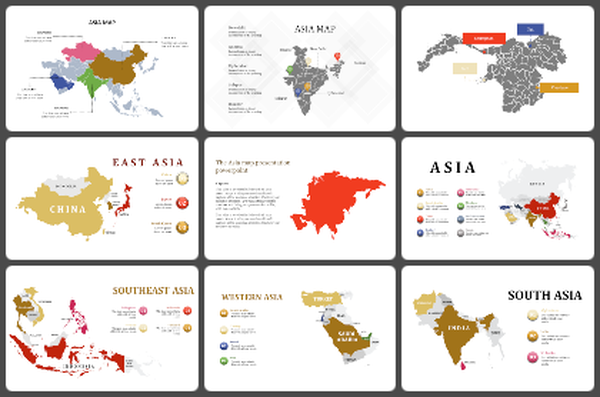
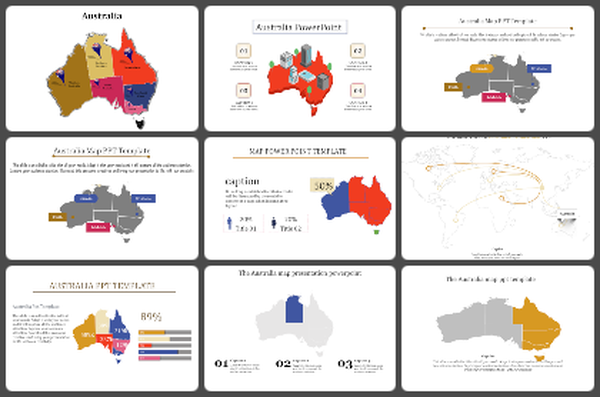
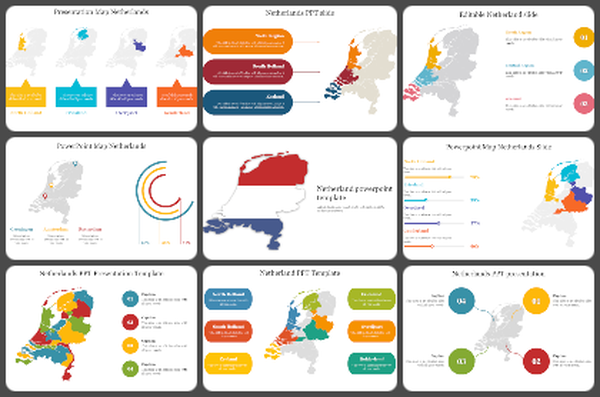
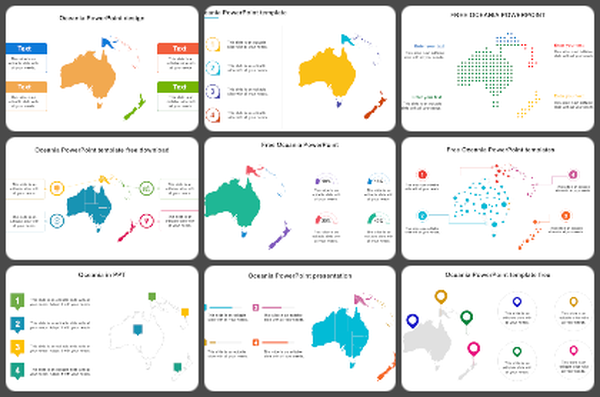
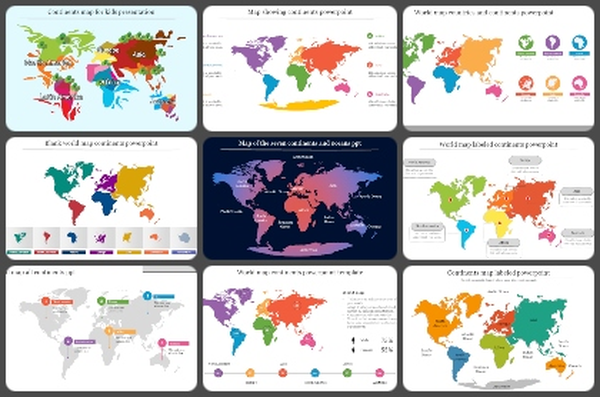
Would you be interested in visiting Mexico City? Never fail to visit Cancun, Mexico's most popular tourist resort. It is a location with spectacular beaches. How about other locations? Utilize our Mexico map infographic templates to view them. This PowerPoint deck now contains more than 36 new slides. You can use it to organize excursions or to convey information about Mexico's people, climate, locations, traditions, and eating customs.

You can discover something new from each slide in this collection, which will all assist you. Each layout is of the highest quality. To suit your content style, you are allowed to freely alter the slides. A tonne of modifiable icons, pictures, themes, and backdrops are present on the slide. Your material will look intriguing because of the themed backgrounds and images. Purchase right away!


Features of the template

  • 100% customizable slides and easy to download.
  • Slides are available in different nodes & colors.
  • The slides contain 16:9 and 4:3 formats.
  • Easy to change the colors quickly.
  • It is a well-crafted template with an instant download facility.
  • It is a Google theme slide.
  • The slides are designed with amazing backgrounds and colors.

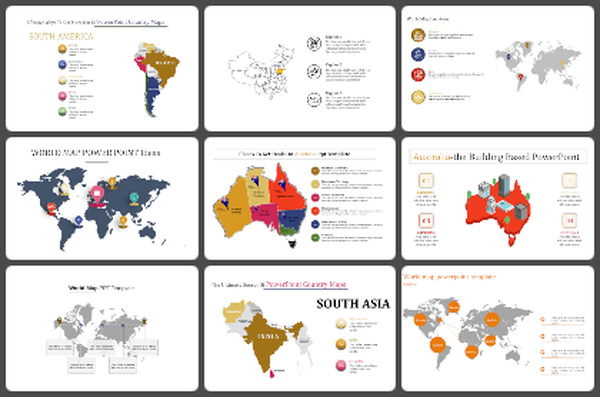
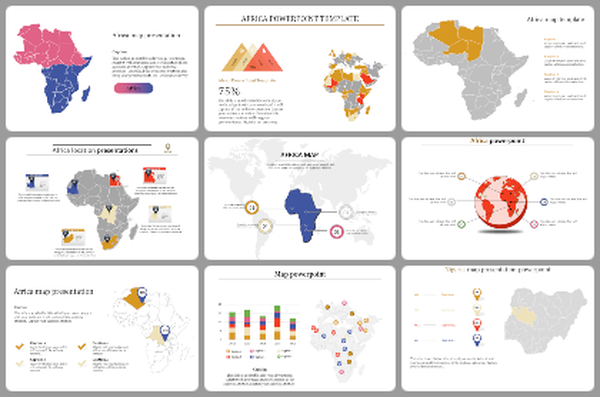
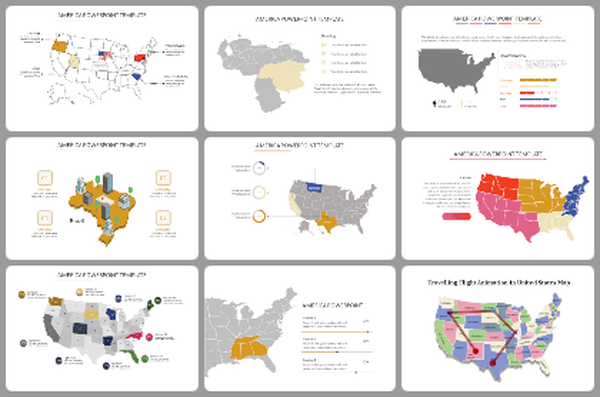
You May Also Like These PowerPoint Templates

Add to Wishlist
Download
AI Customize
Tokyo map with highlighted districts in various colors, and numbered labels for six areas on both sides.
Add to Wishlist
Download
AI Customize
United Arab Emirates map in the center with regions, and six caption areas in different colors on the left and right.
Add to Wishlist
Download
AI Customize
Argentina map with highlighted regions in yellow, orange, purple, and magenta, each labeled with caption areas.
Add to Wishlist
Download
AI Customize
Map highlighting Morocco and surrounding regions in colorful sections with caption areas below.
Add to Wishlist
Download
AI Customize
Map of Southeast Asia highlighting four countries thailand, laos, cambodia, and vietnam, with labeled regions.
Add to Wishlist
Download
AI Customize
PowerPoint slide showcasing a map of Minnesota, highlighting major cities and the state capital.
Add to Wishlist
Download
AI Customize
Slide featuring a map of Japan with color coded regions and three percentage indicators alongside captions for each.
Add to Wishlist
Download
AI Customize
Four Taiwan map outlines with percentage labels in red, blue, purple, and green, each with text areas.
Add to Wishlist
Download
AI Customize
Map Of Thailand Infographics PowerPoint And Google Slides
Add to Wishlist
Download
AI Customize
Map of Southeast Asia featuring infographics slides with color coded regions, percentage data, and statistical charts.
Add to Wishlist
Download
AI Customize
Map of Paris region with orange highlight and demographic icons showing percentage data alongside two circular charts.
Add to Wishlist
Download
AI Customize
Color coded UK map slide highlighting northern ireland, scotland, wales, and england with captions for each region.
Add to Wishlist
Download
AI Customize
Outline of Paris map with blue and red data markers, a flag icon, and two caption boxes for additional details.
Add to Wishlist
Download
AI Customize
Use Thailand Map PowerPoint Presentation Template Design
Add to Wishlist
Download
AI Customize
World map slide with four blue location markers, each featuring a caption and numbered icons.
Add to Wishlist
Download
AI Customize
Map of South Asia with marked cities and capitals like New Delhi, Islamabad, and Dhaka, with three placeholders text.
Add to Wishlist
Download
AI Customize
Colorful map of the united states illustrating a flight animation route, highlighting states with connecting lines.
Add to Wishlist
Download
AI Customize
Map of North Carolina featuring five numbered location markers and a large percentage with two smaller percentage boxes.
Add to Wishlist
Download
AI Customize
Simple gray map of Japan with seven colorful dotted lines and markers highlighting specific areas in a text box.
Add to Wishlist
Download
AI Customize
World map graphic slide featuring dotted regions with labeled markers, indicating five key locations with captions.
Add to Wishlist
Download
AI Customize
Map of vietnam slide highlighting various provinces with corresponding descriptions.
Add to Wishlist
Download
AI Customize
France map template with a circular infographic showing percentage options labeled as Option 01 to 04.
Free
Add to Wishlist
Download
AI Customize
Map of the UK highlighting North West England with placeholder text on the left.
Add to Wishlist
Download
AI Customize
Infographic slides on America with maps, charts, and icons, covering regional data and insights across multiple countries.
Add to Wishlist
Download
AI Customize
Colorful map of South Korea displaying various regions with corresponding captions.
Add to Wishlist
Download
AI Customize
A template with a map of North Africa, highlighting Morocco and two pie charts with captions areas.
Add to Wishlist
Download
AI Customize
UAE map with four colored percentage bars representing different regions on the left and corresponding text on the right.
Add to Wishlist
Download
AI Customize
Map showing Singapore highlighted with its flag, along with information on its capital, currency, and population with icons.
Free
Add to Wishlist
Download
AI Customize
Map of Oceania with highlighted regions in different colors, alongside four text boxes in blue, orange, pink, and green.
Add to Wishlist
Download
AI Customize
World map with Scotland highlighted in red and a description box providing additional details.
Add to Wishlist
Download
AI Customize
Slide displaying a gray world map with purple labels marking major cities across different continents.
Add to Wishlist
Download
AI Customize
Map of Turkmenistan highlighting provinces such as Dasoguz, Mary, and Ahal, with caption areas.
Add to Wishlist
Download
AI Customize
New York map on the right with colorful markers and a bar chart on the left showing captions in green and red.