Best Demographics PowerPoint And Google Slides Templates

Pack of 31 slides
P.ID : 54027
Advertisement
1.8K+ views
376 Downloads
Get Custom Slides by Experts
Instantly Access Templates in PowerPoint

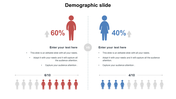
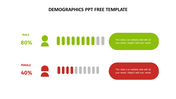
Demographics Presentation Slide

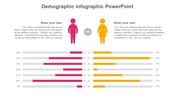
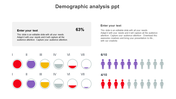
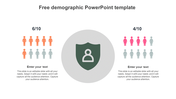
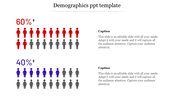
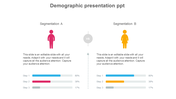
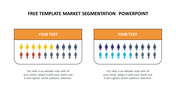
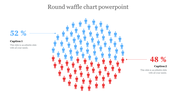
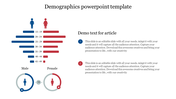
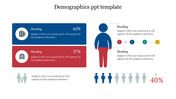
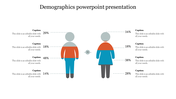
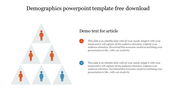
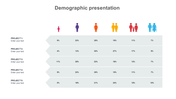
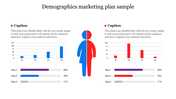
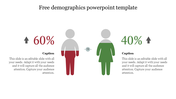
Demographics is the study of population characteristics such as age, gender, income, education, and ethnicity. It is used to understand the makeup of a population and its changes over time. By analyzing demographic data, businesses and organizations can gain valuable insights into consumer behavior, target specific demographics with marketing campaigns, and develop products and services tailored to the needs and preferences of different groups. Slide Egg serves you with multiple elements in the slide like charts, graphs, etc. Through that you can picturize a complex data into simple view.


Features of the template:

  • 100% customizable slides and easy to download. 
  • The slides contained in 16:9 and 4:3 formats.
  • This slides has a colorful design pattern.
  • Highly compatible with PowerPoint and Google Slides.
  • Well-crafted template with instant download facility.
  • Creative design with text area.

You May Also Like These PowerPoint Templates

Add to Wishlist
Download
AI Customize
Demographic slide with a bar chart, a segmented human icon, and four descriptive boxes to the right.
Add to Wishlist
Download
AI Customize
Demographic PowerPoint slide showing population data across four years with different colored icons representing percentages.
Add to Wishlist
Download
AI Customize
Survey result visualization showing 60% male and 40% female voting intention, displayed with person icons and a chart.
Add to Wishlist
Download
AI Customize
Chart with blue and orange bars representing male and female demographics, along with icons for each gender.
Add to Wishlist
Download
AI Customize
Demography PowerPoint template showcasing percentages with colored figures representing data and placeholder text.
Free
Add to Wishlist
Download
AI Customize
Market segmentation template with two sections, each featuring a row of figures representing in various colors.
Add to Wishlist
Download
AI Customize
Survey results template featuring percentages and icons, with 80% represented visually in a red block on the right.
Add to Wishlist
Download
AI Customize
Demographic layout with colored person icons in red and blue, linked with captions and percentage values.
Add to Wishlist
Download
AI Customize
Demographic business strategy infographic slide featuring seven key business areas and an icon representing growth.
Add to Wishlist
Download
AI Customize
Slide showing demographic statistics with orange and pink person icons on either side of a gray shield graphic.
Add to Wishlist
Download
AI Customize
Slide comparing two demographic segments, A and B, with gender icons and corresponding bar charts for three steps.
Add to Wishlist
Download
AI Customize
Layout showing blue and red blocks with percentages, a central figure, and step circles for demographic data visualization.
Add to Wishlist
Download
AI Customize
Demographic PPT presentation slide with four colorful circular sections labeled A, B, C, and D, each with placeholder text.
Add to Wishlist
Download
AI Customize
Demographics PowerPoint Template Presentation Slide
Add to Wishlist
Download
AI Customize
Hexagonal diagram with six colored sections, featuring male and female icons, with numbered labels and captions.
Add to Wishlist
Download
AI Customize
Demographic infographic displaying the population of the USA in 2018 by age group and gender, with male and female sections.
Add to Wishlist
Download
AI Customize
Demographics based PPT slide featuring maps of the United States and Brazil with gender distribution icons and percentages.
Add to Wishlist
Download
AI Customize
Grab dazzling Demographics PPT Free Template presentation
Add to Wishlist
Download
AI Customize
Slide with three colorful human icons representing proportions, with circular percentages and text on the brown sidebar.
Add to Wishlist
Download
AI Customize
Download Demography Slide Template Design Presentation
Add to Wishlist
Download
AI Customize
Illustration of purple male and orange female, by a row of icons indicating the number of individuals, with text areas.
Add to Wishlist
Download
AI Customize
Demographic comparison PowerPoint slide showing a male figure with 60  in red and a female figure with 40 percent in green.
Add to Wishlist
Download
AI Customize
Collection of people infographic slides with colorful charts, graphs, and illustrations representing various demographics.
Add to Wishlist
Download
AI Customize
Best Demographics PowerPoint And Google Slides Templates
Add to Wishlist
Download
AI Customize
Download Free Demographics PPT Template and Google Slides
Add to Wishlist
Download
AI Customize
World map comparison slide with regional demographics showing 80% female and 20% male distribution across continents.
Add to Wishlist
Download
AI Customize
Demographic comparison of male and female data in pink and yellow bars for different age categories.
Add to Wishlist
Download
AI Customize
An infographic showing survey evaluations from July to October 2023, with icons representing the number of respondents.
Add to Wishlist
Download
AI Customize
Infographic showing demographic data with colorful circular pie charts, text boxes, and colored figures in purple and red.