Waffle Charts PowerPoint PPT Presentation Template

PPT slide displaying 2 waffle charts with percentages and person icons, showing data in green and white theme with captions.
P.ID : 47959
    310 views
    41 Downloads
    Get Custom Slides by Experts
    Instantly Access Templates in PowerPoint

    Interesting Waffle Charts Template

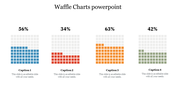
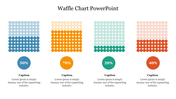
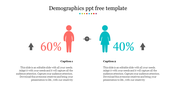
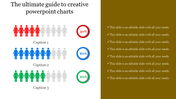
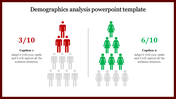
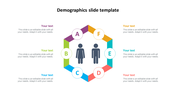
    The waffle chart is the standard representation of extensive data into tiny dots, divided into small and multiple units in different forms. The dots are colored vibrantly and give the best effect, making the audience understand the core information and bringing in new changes in the system. So you can use this template to show your data processing and cloud computing in a segmented way to make your presentation successful. Edit this template with the customizable feature and mark your success as this template is improvised on editing. Download now!

    Features of the Template:

    • 100% customizable slides and easy to download.
    • The slide contains 16:9 and 4:3 formats. 
    • Slides are available in different nodes & colors. 
    • Easy to change the colors of the slide quickly.
    • Well-crafted template with an instant download facility.
    • Dots design with text area. 
    Advertisement

    You May Also Like These PowerPoint Templates

    Add to Wishlist
    Download
    AI Customize
    Illustration of purple male and orange female, by a row of icons indicating the number of individuals, with text areas.
    Add to Wishlist
    Download
    AI Customize
    Demographic comparison PowerPoint slide showing a male figure with 60  in red and a female figure with 40 percent in green.
    Add to Wishlist
    Download
    AI Customize
    Collection of people infographic slides with colorful charts, graphs, and illustrations representing various demographics.
    Add to Wishlist
    Download
    AI Customize
    Best Demographics PowerPoint And Google Slides Templates
    Add to Wishlist
    Download
    AI Customize
    Download Free Demographics PPT Template and Google Slides
    Add to Wishlist
    Download
    AI Customize
    World map comparison slide with regional demographics showing 80% female and 20% male distribution across continents.
    Add to Wishlist
    Download
    AI Customize
    Demographic comparison of male and female data in pink and yellow bars for different age categories.
    Add to Wishlist
    Download
    AI Customize
    Colorful waffle chart with segmented blue, teal, red, and orange blocks, surrounded by corresponding percentage captions.
    Add to Wishlist
    Download
    AI Customize
    Pixelated chart with teal, blue, and red columns, and three corresponding caption boxes on the right.
    Add to Wishlist
    Download
    AI Customize
    Waffle chart design with circular icons arranged in five rows, color coded in pink, blue, and teal to represent months.
    Add to Wishlist
    Download
    AI Customize
    Waffle chart PowerPoint slide displaying percentages with color markers and icons with placeholder text.
    Free
    Add to Wishlist
    Download
    AI Customize
    Four waffle chart sections show percentages with corresponding captions.
    Add to Wishlist
    Download
    AI Customize
    Waffle chart analysis slide with multicolored circular data markers with caption sections.
    Add to Wishlist
    Download
    AI Customize
    Waffle chart with apple icons in blue, green, orange, and red, paired with four labeled captions areas on the right.
    Free
    Add to Wishlist
    Download
    AI Customize
    Hexagonal waffle chart with blue, red, and orange sections illustrating proportions and caption areas.
    Add to Wishlist
    Download
    AI Customize
    PPT slide showing a colorful waffle chart with categories Medium, High, and Critical with captions on a white backdrop.