Best Waffle Chart Analysis PPT Presentation

Waffle chart analysis with four percentage based diamond grid visuals in blue, green, orange, and red.
P.ID : 47976
    71 views
    8 Downloads
    Get Custom Slides by Experts
    Instantly Access Templates in PowerPoint

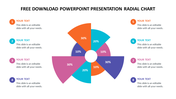
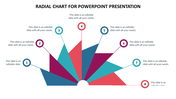
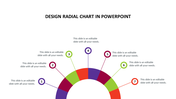
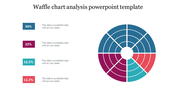
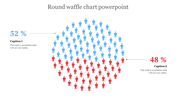
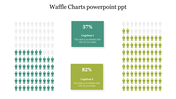
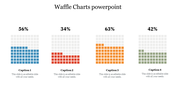
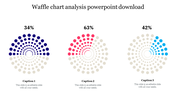
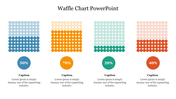
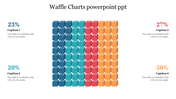
    Best Waffle Chart PPT Template

    Making accurate and stunning waffles is all about balance, symmetry, and attentiveness. Our Best Waffle Chart PPT Slide has all of these qualities, which will make your slides stand out from the crowd. Get amazing-looking waffle charts that add value to your PPTs. Make your cool presentations pop off the page with this awesome slice of a lucky shot. Present your data in the most effective way by using this windfall slide. Have fun designing a waffle chart and impress your audience!

    Features of the template

    • 100% customizable slides and easy to download.
    • Slides are available in different nodes & colors.
    • The slide contained 16:9 and 4:3 formats.
    • Easy to change the slide colors quickly.
    • Well-crafted template with an instant download facility.
    • Four elegant nodes added.
    Advertisement

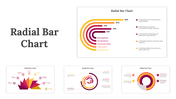
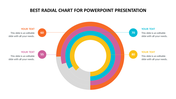
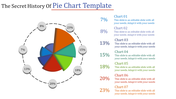
    You May Also Like These PowerPoint Templates

    Add to Wishlist
    Download
    AI Customize
    Pixelated chart with teal, blue, and red columns, and three corresponding caption boxes on the right.
    Add to Wishlist
    Download
    AI Customize
    Waffle chart design with circular icons arranged in five rows, color coded in pink, blue, and teal to represent months.
    Add to Wishlist
    Download
    AI Customize
    Waffle chart PowerPoint slide displaying percentages with color markers and icons with placeholder text.
    Free
    Add to Wishlist
    Download
    AI Customize
    Four waffle chart sections show percentages with corresponding captions.
    Add to Wishlist
    Download
    AI Customize
    Waffle chart analysis slide with multicolored circular data markers with caption sections.
    Add to Wishlist
    Download
    AI Customize
    Waffle chart with apple icons in blue, green, orange, and red, paired with four labeled captions areas on the right.
    Free
    Add to Wishlist
    Download
    AI Customize
    Hexagonal waffle chart with blue, red, and orange sections illustrating proportions and caption areas.
    Add to Wishlist
    Download
    AI Customize
    PPT slide showing a colorful waffle chart with categories Medium, High, and Critical with captions on a white backdrop.
    Add to Wishlist
    Download
    AI Customize
    Waffle chart analysis with four percentage based diamond grid visuals in blue, green, orange, and red.
    Add to Wishlist
    Download
    AI Customize
    Waffle Chart Microsoft PPT Presentation Slide
    Add to Wishlist
    Download
    AI Customize
    Waffle Chart Analysis PowerPoint Template Slides
    Add to Wishlist
    Download
    AI Customize
    Infographic with two grid based waffle charts using emoji icons in blue and red, showing percentages with captions.
    Add to Wishlist
    Download
    AI Customize
    Waffle chart with twelve columns of colored squares in blue, green, yellow, and purple, with matching captions on both sides.
    Add to Wishlist
    Download
    AI Customize
    Waffle chart with blue circles representing sales data over days, alongside a large circular indicator displaying number.
    Add to Wishlist
    Download
    AI Customize
    Waffle chart PowerPoint slide with color coded blocks representing different risk levels with captions on a white backdrop.
    Add to Wishlist
    Download
    AI Customize
    Waffle Chart PowerPoint Presentation And Google Slides
    Add to Wishlist
    Download
    AI Customize
    PowerPoint slide with three waffle charts representing percentages in red, green, and blue sections with captions.
    Add to Wishlist
    Download
    AI Customize
    Waffle Charts PPT PowerPoint Presentation