Radial Chart For PowerPoint Presentation Templates

Visual representation of a radial chart featuring eight sections numbered from one to eight placed in a white background.
P.ID : 49808
    343 views
    59 Downloads
    Get Custom Slides by Experts
    Instantly Access Templates in PowerPoint

    Best Radial Chart Template For Presentation

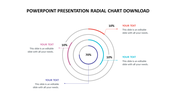
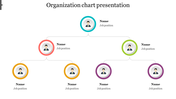
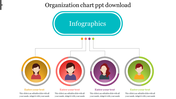
    The radial chart is a graphical representation of multiple data in two or many dimensions. It is the best slide for business purposes. This slide can be used in business meetings and project presentations because it displays vast data in a single picture. This template can be edited and customized very easily. They are very comfortable to use and modify. Grab them and give a striking presentation.

    Features of the template

    • 100 % customizable slides and easy to download.
    • Slides are available in different nodes & colors.
    • The slide contained 16:9 and 4:3 formats.
    • Easy to change the slide colors quickly.
    • It is a well-crafted template with an instant download facility.
    • It is designed with a stunning theme design.
    • Best template for PowerPoint presentations.
    Advertisement

    You May Also Like These PowerPoint Templates

    Add to Wishlist
    Download
    AI Customize
    Organizational chart showing a manager connected to three team leaders, with teams A and B under each leader.
    Add to Wishlist
    Download
    AI Customize
    Organizational chart with color-coded boxes in red, blue, yellow, green, and purple showing company hierarchy.
    Free
    Add to Wishlist
    Download
    AI Customize
    Use Free PowerPoint Template Organizational Chart Slide
    Add to Wishlist
    Download
    AI Customize
    Organization template with a hierarchy of six employees, in circular profile icons and job positions in rectangular boxes.
    Add to Wishlist
    Download
    AI Customize
    Organizational structure slide showcasing a hierarchical chart with captions and subcategories in green and gray color.
    Add to Wishlist
    Download
    AI Customize
    Circular infographic with four layers representing percentages from 52% to 80%, with a lightbulb icon in the center.
    Add to Wishlist
    Download
    AI Customize
    Seven-segment radial chart in various colors, labeled 1 to 7, with editable text descriptions surrounding the chart.
    Add to Wishlist
    Download
    AI Customize
    Radial bar chart template set with circular data visuals, each showcasing percentages and data categories.
    Add to Wishlist
    Download
    AI Customize
    Colorful radial chart slide featuring text sections and data points with values 55, 60, 70, and 80 with placeholder text.
    Free
    Add to Wishlist
    Download
    AI Customize
    Pie chart divided into seven colored sections with percentage labels and a list of chart descriptions on the right.
    Add to Wishlist
    Download
    AI Customize
    A colorful pie chart diagram with concentric circles showing percentages for different data categories in 2021.
    Add to Wishlist
    Download
    AI Customize
    Visual representation of a radial chart featuring eight sections numbered from one to eight placed in a white background.
    Add to Wishlist
    Download
    AI Customize
    Get Flawless Design Radial Chart in PowerPoint Model
    Add to Wishlist
    Download
    AI Customize
    Radial chart PowerPoint template with color coded concentric circles and years with placeholder text on a white backdrop.
    Add to Wishlist
    Download
    AI Customize
    Radial chart infographic with colorful segmented arcs in purple, blue, orange, red, and green, labeled with percentage.
    Add to Wishlist
    Download
    AI Customize
    A colorful radial diagram slide featuring concentric circles with text areas.
    Add to Wishlist
    Download
    AI Customize
    Sales strategy slide with a multicolored chart, business icons, and descriptions for marketing, branding, and planning.