Free Download PowerPoint Presentation Radial Chart Templates

Radial chart with eight sections in various colors, showing percentages, surrounded by numbered text boxes on both sides.
P.ID : 49814
    959 views
    190 Downloads
    Get Custom Slides by Experts
    Instantly Access Templates in PowerPoint

    Make Your Work Interesting With This Template

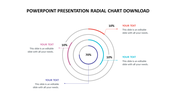
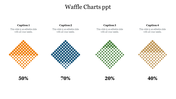
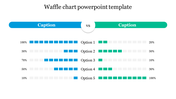
    Give quick access to this template, for it has dynamic graphics. The diagram presented in the center gives a 3D effect to your entire work. The eight nodes presented here are all filled with unique colors that give a distinctive look to your slides. You can compare and examine your various points through the nodes effortlessly using the amicable options we provide. Your analyzing process becomes a stress-free one by downloading these radical charts.

    Features of the template

    • 100% customizable slides and easy to download
    • Slides are available in different nodes & colors.
    • The slides contained 16:9 and 4:3 formats.
    • Easy to change the slide colors quickly.
    • Well-crafted template with instant download facility.
    • Informative nodes and icons are given.
    • Spacious nodes are inserted.
    Advertisement

    You May Also Like These PowerPoint Templates

    Add to Wishlist
    Download
    AI Customize
    Waffle charts in four colors representing percentages 54% in blue, 70% in green, 60% in orange, and 40% in red.
    Add to Wishlist
    Download
    AI Customize
    Semi circular waffle chart with blue and pink segments, illustrating percentage differences in two categories.
    Add to Wishlist
    Download
    AI Customize
    Slide with four waffle charts, each displaying a percentage with colored square grids in blue, red, orange, and green.
    Add to Wishlist
    Download
    AI Customize
    Simple Waffle Chart Analysis PowerPoint Download
    Add to Wishlist
    Download
    AI Customize
    Four colored waffle charts showing different percentage values with corresponding captions and placeholder text.
    Add to Wishlist
    Download
    AI Customize
    Circular infographic with four layers representing percentages from 52% to 80%, with a lightbulb icon in the center.
    Add to Wishlist
    Download
    AI Customize
    Seven-segment radial chart in various colors, labeled 1 to 7, with editable text descriptions surrounding the chart.
    Add to Wishlist
    Download
    AI Customize
    Sales strategy slide with a multicolored chart, business icons, and descriptions for marketing, branding, and planning.
    Add to Wishlist
    Download
    AI Customize
    A colorful pie chart diagram with concentric circles showing percentages for different data categories in 2021.
    Add to Wishlist
    Download
    AI Customize
    A colorful radial diagram slide featuring concentric circles with text areas.
    Add to Wishlist
    Download
    AI Customize
    Radial bar chart template set with circular data visuals, each showcasing percentages and data categories.
    Add to Wishlist
    Download
    AI Customize
    Colorful radial chart slide featuring text sections and data points with values 55, 60, 70, and 80 with placeholder text.
    Free
    Add to Wishlist
    Download
    AI Customize
    Pie chart divided into seven colored sections with percentage labels and a list of chart descriptions on the right.
    Add to Wishlist
    Download
    AI Customize
    Visual representation of a radial chart featuring eight sections numbered from one to eight placed in a white background.
    Add to Wishlist
    Download
    AI Customize
    Get Flawless Design Radial Chart in PowerPoint Model
    Add to Wishlist
    Download
    AI Customize
    Radial chart PowerPoint template with color coded concentric circles and years with placeholder text on a white backdrop.
    Add to Wishlist
    Download
    AI Customize
    Radial chart infographic with colorful segmented arcs in purple, blue, orange, red, and green, labeled with percentage.