Waffle Charts Template PPT Presentation Slides

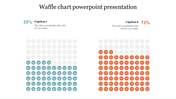
Awesome Waffle Chart PowerPoint Presentation
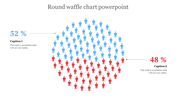
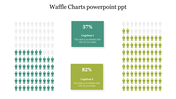
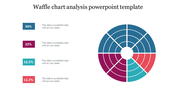
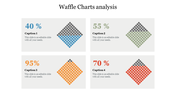
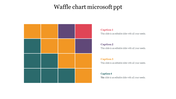
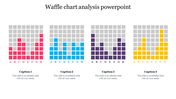
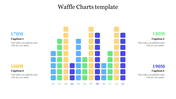
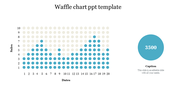
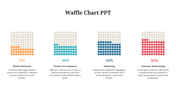
When creating a new presentation about statistical data, you should be aware of the best possible strategy. A waffle chart displays progress toward a goal or a percentage of completion. Making your ideas understandable using a powerful Waffle chart template will hasten their acceptance. Small cells are arranged in a grid, and the colored cells serve as the data. You may quickly add ideas for the topic with the aid of the template. You may take these three slides and add your own text. If you prefer to avoid dense writing, pick this vibrant template.
Features of the template
- 100 % customizable slides and easy to download.
- Slides are available in different colors
- The slide has 4:3 and 16:9 formats.
- Easy to change the slide colors quickly.
- Appealing presentation to impress an audience.
- Create feature-rich slide presentations.
- An eye-pleasing color slide helps to give a catchy presentation.
- Crisp and clear font styles.
- Four nodes with grid designs.


You May Also Like These PowerPoint Templates
Add to Wishlist
Download
AI Customize

Add to Wishlist
Download
AI Customize

Add to Wishlist
Download
AI Customize

Add to Wishlist
Download
AI Customize

Add to Wishlist
Download
AI Customize

Add to Wishlist
Download
AI Customize

Add to Wishlist
Download
AI Customize

Add to Wishlist
Download
AI Customize

Add to Wishlist
Download
AI Customize

Add to Wishlist
Download
AI Customize

Add to Wishlist
Download
AI Customize

Add to Wishlist
Download
AI Customize

Add to Wishlist
Download
AI Customize

Add to Wishlist
Download
AI Customize

Add to Wishlist
Download
AI Customize


Add to Wishlist
Download
AI Customize

Add to Wishlist
Download
AI Customize


Add to Wishlist
Download
AI Customize
