Innovative Gantt Charts PowerPoint And Google Slides Themes

Pack of 31 slides
P.ID : 53611
Advertisement
1.8K+ views
407 Downloads
Get Custom Slides by Experts
Instantly Access Templates in PowerPoint

Customizable Gantt Charts Presentation Slides


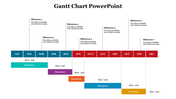
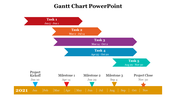
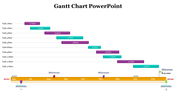
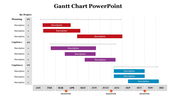
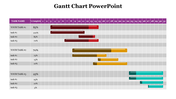
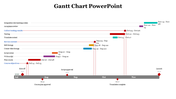
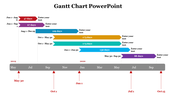
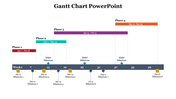
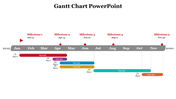
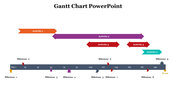
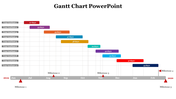
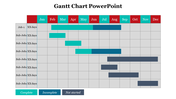
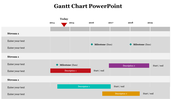
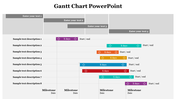
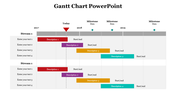
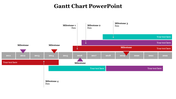
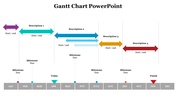
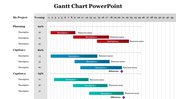
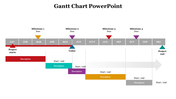
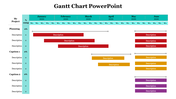
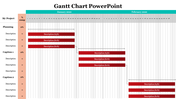
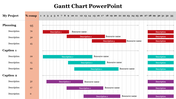
Want to streamline your project planning and management?  Gantt charts are a versatile project management tool that shows you the big picture of your project, including tasks, deadlines, and dependencies. With Gantt charts, you can easily visualize project timelines, monitor progress, and adjust your plan as needed. Best of all, our creative Gantt chart templates are designed for your needs. So, you can also upgrade your project management data today with our slide deck and see how it works.

Features of this templates


  • 100% customizable slides and easy to download.
  • The slide contains 16:9 and 4:3 formats.
  • Easy to change the colors of the slide quickly.
  • Highly compatible with PowerPoint and Google Slides.

You May Also Like These PowerPoint Templates

Add to Wishlist
Download
AI Customize
Green circular chart with five segments labeled by categories and percentages, with descriptions around it.
Add to Wishlist
Download
AI Customize
Chart PPT template showing 4 progress circles with percentages and color coded sections for Blue, Green, Yellow, and Orange.
Add to Wishlist
Download
AI Customize
Dashboard layout with bar, pie, and stacked charts in yellow, orange, red, and green on a white background.
Add to Wishlist
Download
AI Customize
Infographic featuring pie graph, horizontal and vertical bar charts for visualizing data trends and comparisons.
Free
Add to Wishlist
Download
AI Customize
Illustrative slide combining a pie chart with 45% in green and five silhouette icons to convey data distribution.
Free
Add to Wishlist
Download
AI Customize
Vertical bar chart with three purple bars increasing from 2019 to 2021, each labeled with percentages, and a businesswoman.
Add to Wishlist
Download
AI Customize
Executive slide showing expense meters, world sales performance, and bar graphs for margin, expenses, and revenue by month.
Add to Wishlist
Download
AI Customize
KPI template displaying financial metrics, including sales, profitability, liquidity, and leverage, with two gauge charts.
Add to Wishlist
Download
AI Customize
Executive dashboard slide with a pie chart, bar graph, area chart, and a profile section for job title and details.
Add to Wishlist
Download
AI Customize
Central 3D pie chart with eight colorful segments, each linked to numbered captions placed around it.
Add to Wishlist
Download
AI Customize
KPI template with three gauges displaying progress levels for sales, production, and downloads.
Free
Add to Wishlist
Download
AI Customize
Business pie chart template with a car background, featuring sections labeled with text and pie chart values.
Free
Add to Wishlist
Download
AI Customize
Marketing plan slide showing green bar chart with upward arrow, alongside three text and icons.
Add to Wishlist
Download
AI Customize
Customized PowerPoint Charts Template Presentation
Add to Wishlist
Download
AI Customize
Colorful pie chart with six segments, each labeled with percentages and color-coded text on the right.
Add to Wishlist
Download
AI Customize
A dashboard PPT slide with bar charts for Zantedeschia, Celosia, and Calendula, and three colorful gauge indicators.
Add to Wishlist
Download
AI Customize
Dashboard presentation slide with a line chart trend and circular charts highlighting project progress percentages.
Add to Wishlist
Download
AI Customize
Infographic charts for PowerPoint slide featuring bar, pie, and map charts in different styles and colors.
Free
Add to Wishlist
Download
AI Customize
Five vertical purple bars in a row, each on a gray base, with a businesswoman figure on the right side.
Add to Wishlist
Download
AI Customize
Executive dashboard slide with gender bar chart, line graph,pie chart, and area chart for executive data analysis.
Free
Add to Wishlist
Download
AI Customize
Template with six green bar graphs labeled by years from 2016 to 2021, and a woman in a formal outfit.
Free
Add to Wishlist
Download
AI Customize
Bar chart comparing business targets and profits across quarters, with orange and blue bars labeled by month.
Add to Wishlist
Download
AI Customize
Budget slide featuring a colorful donut chart with percentages and five categories with placeholder text.
Add to Wishlist
Download
AI Customize
Electricity dashboard showing a bar chart on the left and a line chart on the right, depicting electricity data.
Add to Wishlist
Download
AI Customize
Dashboard slide with three gauges displaying percentage levels, labeled low, middle, and high with placeholder text.
Add to Wishlist
Download
AI Customize
Colorful pie chart in PowerPoint slide showing 60, 30, and 10 percent segments with text boxes on a white backdrop.
Free
Add to Wishlist
Download
AI Customize
Five triangular red pyramids arranged by size with corresponding percentage values, set against a minimalist gray background.
Add to Wishlist
Download
AI Customize
Dashboard overview slide displaying traffic, payment, server load, expenses, and product metrics using graphs and charts.
Free
Add to Wishlist
Download
AI Customize
Bar graph comparing financial data with blue and purple theme, with a text box explaining a high level approach.
Add to Wishlist
Download
AI Customize
Slide with a pie chart and a numbered list of five levels, each in orange, red, blue, green, and yellow.
Add to Wishlist
Download
AI Customize
Cycle chart slide featuring four percentage indicators in teal, green, blue, and red, with captions beow.
Free
Add to Wishlist
Download
AI Customize
Timeline slide with horizontal bars in shades of green and blue, aligned to weekdays with placeholder text.
Free
Add to Wishlist
Download
AI Customize
KWL chart PowerPoint template with sections for What I Know, What I Want to Know, and What I Learned with placeholder text.
Add to Wishlist
Download
AI Customize
Five vibrant 3D blocks in purple, green, orange, blue, and yellow, with captions for each section.