Gantt Chart Presentation PowerPoint And Google Slides

Project schedule slide with a Gantt chart displaying tasks, timelines, and completion percentages.
P.ID : 34196
    1.5K+ views
    145 Downloads
    Get Custom Slides by Experts
    Instantly Access Templates in PowerPoint

    Simple Gantt Chart Presentation PPT


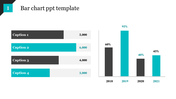
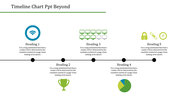
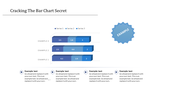
    This template features a clean and easy-to-understand Gantt chart presentation PPT template layout with three color-coded sections. Each section has a clear title, caption area, and ample space to detail your project tasks. No more confusing spreadsheets or messy handwritten timelines!

    Whether you're a project management pro or just starting out, this template helps you communicate plans with laser focus. Simply fill in the pre-formatted sections with your project details, and voila! A clear and compelling presentation in minutes.

    A visual Gantt chart keeps everyone on the same page. Your team can easily see project timelines and dependencies, helping you spot potential roadblocks early and ensure smooth sailing.

    This template is your key to streamlining project communication and boosting teamwork. Stop the project panic and get started today! Watch your projects go from chaotic to conquering!

    Features of the template


    • 100% customizable slides and easy to download.
    • The slides contain 16:9 and 4:3 formats.
    • Easy to change the colors quickly.
    • It is a well-crafted template with an instant download facility.
    • It is a 100% pre-designed slide.
    • The slide holds vibrant colors.
    Advertisement

    You May Also Like These PowerPoint Templates

    Add to Wishlist
    Download
    AI Customize
    3D cone charts in blue shades with percentage labels, showing two datasets with a legend on the right.
    Add to Wishlist
    Download
    AI Customize
    KPI dashboard with a mix of bar, pie, and line charts highlighting revenue, sales, and customer buying patterns.
    Add to Wishlist
    Download
    AI Customize
    Dashboard PPT template with three colored gauges showing 30, 60, and 90 percent completion with captions.
    Add to Wishlist
    Download
    AI Customize
    Slide showing a bar chart with values for 2017, 2018, 2019, and 2020, with each year represented in different shades of blue.
    Add to Wishlist
    Download
    AI Customize
    Matrix chart with skill and will axes, divided into quadrants labeled high and low, with numbered circles and icons.
    Add to Wishlist
    Download
    AI Customize
    PowerPoint chart template displaying three donut charts with percentages and icons representing data categories.
    Add to Wishlist
    Download
    AI Customize
    KPI PowerPoint template with a gauge and table for displaying yearly financial data on a white backdrop.
    Add to Wishlist
    Download
    AI Customize
    Bar chart presentation showing data from 2017 to 2020, with values 2.4, 4.4, 1.8, and 2.8, respectively.
    Free
    Add to Wishlist
    Download
    AI Customize
    Horizontal timeline graphic with five purple arrows, labeled captions and date ranges, aligned with a month indicator.
    Add to Wishlist
    Download
    AI Customize
    Dashboard PPT slide showcasing defect rates, supplier analysis, revenue breakdown, and delivery time analysis with charts.
    Add to Wishlist
    Download
    AI Customize
    KPI PowerPoint slide featuring three colored gauges for Revenue, Sales, and Sales Value with respective values.
    Add to Wishlist
    Download
    AI Customize
    KPI dashboard template with bar and line graphs showing private school growth for 2017, 2018, and 2019 with educational data.
    Free
    Add to Wishlist
    Download
    AI Customize
    Free KPI Presentation PPT Template and Google Slides
    Add to Wishlist
    Download
    AI Customize
    3D pie chart with four color-coded segments red, orange, yellow, and brown displaying percentage values.
    Add to Wishlist
    Download
    AI Customize
    PPT template for an annual report featuring a bar graph comparing data across three time periods with color coded categories.
    Free
    Add to Wishlist
    Download
    AI Customize
    Bar chart slide with three stacked bars, each divided into segments with percentage labels, and a table on the right.