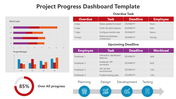
Try Our Predesigned KPI Dashboard Template Presentation

Try Our Predesigned KPI Dashboard Template Presentation
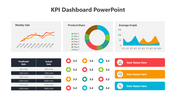
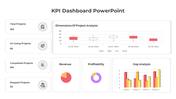
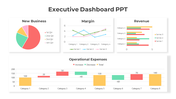
This Editable template features a clean and modern design with a focus on clear communication and actionable insights. It includes pre-built dashboards for common business goals like sales, marketing, finance, and customer service, making it easy to get started quickly. Plus, it's fully customizable, so you can tailor it to your specific needs and brand. From Student to CEO, This Template Empowers Everyone Whether you're a U.S. business professional creating a quarterly report, a student analyzing marketing campaign data, or an entrepreneur pitching your latest venture, this template is designed to empower you.
It's easy to use, even for those with no design experience, and it will help you present your data in a way that's clear, concise, and impactful. By choosing our KPI dashboard Template you can Say goodbye to data overload and look sharp and professional: Impress your audience with a modern and polished design that reflects your brand. Save time and effort: Get started quickly with pre-built layouts and drag-and-drop functionality. Boost communication and collaboration: Facilitate better decision-making by sharing clear and actionable insights with your team. Download the KPI Dashboard PPT Template today and start turning your data into success stories!
Features of the template:
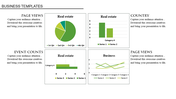
- Slides are available in different sizes and colors.
- Easy to change the slide colors.
- Well-crafted template with instant download.


You May Also Like These PowerPoint Templates


