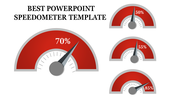
Presentation Tachometer PPT Download Template For PPT

Slide with three tachometer dials in blue, purple, and pink, each aligned above a matching caption box.
P.ID : 48959
    146 views
    14 Downloads
    Get Custom Slides by Experts
    Instantly Access Templates in PowerPoint

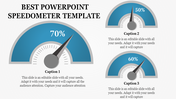
    Three Informative Diagram Inserted Template:


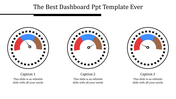
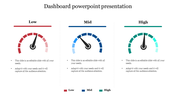
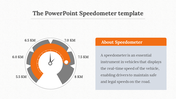
    Prominent presentation tachometer ppt download template with attractive colors on them. The tachometer symbol, which is inserted in all the diagrams, represents various facts. The presentation tachometer ppt download template can be used in any slides to which it can be added. 

    The caption space given below the diagram is very spacious to provide informative points about your topic. The nodes are rectangular with eye-catchy colors in them. There is also a title space for you at the top of the template to make it more professional. Don't miss this attributes-loaded template which is available on SlideEgg.

    Features of this Template:

    • 100% customizable slides and easy to download.
    • Slides available in different nodes & colors.
    • The Slide contained 16:9 and 4:3 format.
    • Easy to change the slide colors quickly.
    • Well-crafted Template with instant download facility.
    • Colorful Template with elegant fonts.
    • Template for professional use.
    Advertisement

    You May Also Like These PowerPoint Templates

    Add to Wishlist
    Download
    AI Customize
    Slide deck of energy dashboards displaying data visualizations like pie charts, bar and line graphs, in green shades.
    Free
    Add to Wishlist
    Download
    AI Customize
    KPI dashboard layout with blue semicircle gauges and line charts representing social media performance metrics.
    Free
    Add to Wishlist
    Download
    AI Customize
    Dashboard layout with three semicircular gauges in orange and brown tones, paired with captions, on a beige background.
    Add to Wishlist
    Download
    AI Customize
    Dashboard-themed slide with semi-circle charts for business analysis, featuring metrics and reflective silhouettes at the bottom.
    Add to Wishlist
    Download
    AI Customize
    Bar chart infographic with four blue bars for kpi forecasts, a line graph overlay, and a man with a magnifying glass.
    Add to Wishlist
    Download
    AI Customize
    Four colored circular progress, one is higlighted in a box with a pie chart, and a bar chart labelled with sections.
    Add to Wishlist
    Download
    AI Customize
    Comprehensive program dashboard featuring charts and gauges for quality, budget, risks, overall project map, progress, and resource updates.
    Free
    Add to Wishlist
    Download
    AI Customize
    Four black speedometers with white numbers and yellow markers arranged in a two by two grid with descriptions.
    Add to Wishlist
    Download
    AI Customize
    KPI infographic slide deck, combining line and bar graphs,  pie charts, and performance dials for data representation.
    Add to Wishlist
    Download
    AI Customize
    Semi circular gauge with six color coded sections from green to red, With numbers 01 to 06, labeled KPI at the bottom.
    Add to Wishlist
    Download
    AI Customize
    KPI dashboard featuring financial data with profit trends and metrics visualized through charts and dials.
    Free
    Add to Wishlist
    Download
    AI Customize
    Dashboard template with five numbered columns and placeholders text areas in different shades of grey theme.
    Add to Wishlist
    Download
    AI Customize
    PowerPoint speedometer template featuring three speed gauges.
    Add to Wishlist
    Download
    AI Customize
    Circular tachometer divided into four sections  in blue, red, purple, and teal, featuring transport icons and captions.
    Add to Wishlist
    Download
    AI Customize
    Dashboard PowerPoint template featuring three speedometer graphics labeled with captions.