Creative Speedometer PowerPoint Template And Google Slides

PowerPoint speedometer template with a gauge reading from 5.5 to 8.0 km and an informational text box on the side.
P.ID : 35626
    128 views
    13 Downloads
    Get Custom Slides by Experts
    Instantly Access Templates in PowerPoint

    Drive Your Presentations Forward with our Speedometer Template


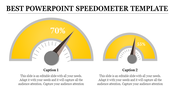
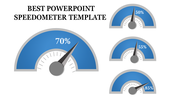
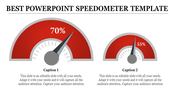
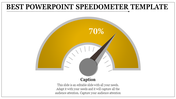
    Our Speedometer PowerPoint Template features a sleek speedometer graphic with six-speed indicators, providing a visually engaging way to represent progress, performance, or project milestones. Accompanied by a spacious text area, this template allows you to annotate and explain the data or metrics displayed on the speedometer.

    This template is ideal for professionals in industries such as project management, performance tracking, sales, or any field where measuring progress and setting goals is paramount. Whether you're presenting project updates, performance reports, or sales targets, our Speedometer PowerPoint Template empowers you to convey information effectively and drive your presentations toward success.

    Rev up your presentations and steer your audience in the right direction with our template. 

    Features of the template


    • 100% customizable slides are easy to download.
    • Slides are available in different colors.
    • The slide has 4:3 and 16:9 formats.
    • It is easy to change the slide colors quickly.
    • It has a cute design to impress an audience.
    • Create feature-rich, animated presentations.
    Advertisement

    You May Also Like These PowerPoint Templates

    Add to Wishlist
    Download
    AI Customize
    Chart design slide tracking article likes, comments, shares, total posts, and new subscriber growth with visual graphs.
    Add to Wishlist
    Download
    AI Customize
    Speedometer PowerPoint template with yellow background showing a 70 percent reading, along with 50 and 60 percent gauges.
    Add to Wishlist
    Download
    AI Customize
    Executive dashboard featuring a bar chart of project tasks, pie chart for project distribution, and a line graph.
    Free
    Add to Wishlist
    Download
    AI Customize
    Speedometer graphic with a blue progress bar, labeled distance values, and a right-side text box explaining its concept.
    Add to Wishlist
    Download
    AI Customize
    Chart PPT template with bar graphs showing clicks and recipients, a pie chart for email categories, and a line graph.
    Add to Wishlist
    Download
    AI Customize
    Dashboard layout with horizontal bar charts and circular progress indicators in green, yellow, orange, and blue.
    Add to Wishlist
    Download
    AI Customize
    Amazing PowerPoint Dashboard Presentation Template
    Add to Wishlist
    Download
    AI Customize
    Circular tachometer gauge with a needle pointing six colored sections, and captions in rounded rectangles connected by lines.
    Free
    Add to Wishlist
    Download
    AI Customize
    Circular gauge style infographic in shades of gray, showing a speedometer with a needle and distance markers.
    Add to Wishlist
    Download
    AI Customize
    Business executive dashboard template displaying project information, including date and editor with placeholder text.
    Add to Wishlist
    Download
    AI Customize
    Dashboard themed slide with a semi circular gauge showing four icons for speedometers and a central needle pointer.
    Add to Wishlist
    Download
    AI Customize
    Dashboard layout with gauges, bar charts, line graphs, and progress indicators for business performance metrics.
    Add to Wishlist
    Download
    AI Customize
    Green speedometer graphics illustrating performance levels at 70, 50, 55, and 85 percent in a PowerPoint template.
    Add to Wishlist
    Download
    AI Customize
    A tachometer graphic for PowerPoint, featuring different colored sections and text placeholders.
    Add to Wishlist
    Download
    AI Customize
    Four yellow speedometer graphics showing percentages of 70%, 50%, 55%, and 85% placed in a white background.
    Add to Wishlist
    Download
    AI Customize
    Dashboard PowerPoint template with progress bars, circular steps, and a multi color bar chart for tracking metrics.