Amazing PowerPoint Dashboard Presentation Template

Amazing PowerPoint Dashboard Presentation Template
P.ID : 61395
    326 views
    35 Downloads
    Get Custom Slides by Experts
    Instantly Access Templates in PowerPoint

    Exclusive PowerPoint Dashboard template

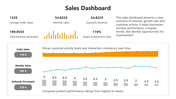
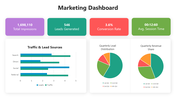
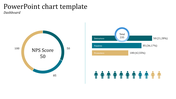
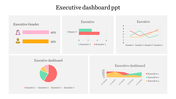
    Get this exclusive Dashboard PowerPoint template for your fantastic presentation. The template is effective and is added with a colorful graphic design and is effective with percentage design.


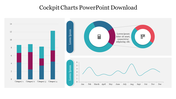
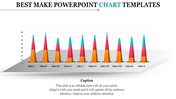
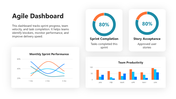
    The template is creative and can make the audience understand the topic clearly. Yes, there is a variety seen in the given four nodes. Each node is given differently where it is added with graph, percentage, level, and bar graph to express your topic even more clearly.

    The dashboard can show the most used app or something related to your business. Since this template is fully customized, it is more accessible to edit and brings all the necessary details into this slide.

    You will be able to enhance the view of your template using user-friendly features. Make sure to download this 100% good template and gain success. Gain the attention of the audience and shine in your way.

    Features of this Template:

    • Easy to change the slide colors quickly.
    • Well-crafted template with instant download facility.
    • 100% customizable slides and easy to download.
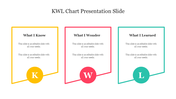
    • Slides are given in different nodes & colors.
    • The slide is designed in 16:9 and 4:3 format.
    • Dashboard design with four nodes.
    Advertisement

    You May Also Like These PowerPoint Templates

    Free
    Add to Wishlist
    Download
    AI Customize
    Timeline slide with horizontal bars in shades of green and blue, aligned to weekdays with placeholder text.
    Free
    Add to Wishlist
    Download
    AI Customize
    Green radial gauge with a modern layout, surrounded by five labeled rectangular sections on a neutral background.
    Add to Wishlist
    Download
    AI Customize
    Colorful dashboard PPT slide with world map, pie charts, bar graphs, and metrics with placeholder text.
    Free
    Add to Wishlist
    Download
    AI Customize
    KWL chart PowerPoint template with sections for What I Know, What I Want to Know, and What I Learned with placeholder text.
    Add to Wishlist
    Download
    AI Customize
    Use Dashboard PPT Template Slide Designs
    Add to Wishlist
    Download
    AI Customize
    Slide with three donut shaped percentage charts showing 70%, 50%, and 90%, with corresponding captions beneath each.
    Add to Wishlist
    Download
    AI Customize
    Gantt chart in blue tones, showing task progress over weeks with horizontal bars and assigned team members.
    Free
    Add to Wishlist
    Download
    AI Customize
    Dashboard template with three colorful gauge icons in the center and text boxes in green, blue, and gold.
    Free
    Add to Wishlist
    Download
    AI Customize
    PowerPoint slide with a project dashboard showing two speedometers to represent project progress with captions.
    Add to Wishlist
    Download
    AI Customize
    KPI dashboard with bar graphs showing data trends over time and two green summary boxes.
    Free
    Add to Wishlist
    Download
    AI Customize
    Dashboard PPT template featuring a speedometer with labeled sections like Direction, Objectives, Data, Business, and Study.
    Add to Wishlist
    Download
    AI Customize
    Vehicle dashboard slide featuring a speedometer on the left and a detailed table on the right with its brands.
    Free
    Add to Wishlist
    Download
    AI Customize
    A PPT chart template featuring a table layout with rows labeled Text and columns with bar charts in different shades of blue.
    Add to Wishlist
    Download
    AI Customize
    Bar chart slide design with stacked bars showing three categories per item and percentage captions on the left.
    Add to Wishlist
    Download
    AI Customize
    A donut chart with four sections in green, red, and white, labeled with percentages, and text boxes around it.
    Add to Wishlist
    Download
    AI Customize
    Business column chart template showing four bar sections, each representing industries with icons and data percentages.
    Add to Wishlist
    Download
    AI Customize
    Colorful bar chart slide for an annual report in PowerPoint, displaying monthly data from January to December.
    Add to Wishlist
    Download
    AI Customize
    Colorful bar chart PPT template displaying four sections with data values and corresponding captions for 2018 to 2021.