Speedometer Chart PowerPoint Template & Google Slides

Three speedometer charts slide with captions indicating different data points, highlighted in green, yellow, and orange.
P.ID : 62857
    3K+ views
    552 Downloads
    Get Custom Slides by Experts
    Instantly Access Templates in PowerPoint

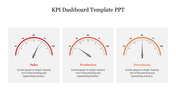
    Three Noded Speedometer PPT Slide

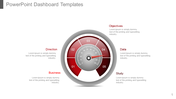
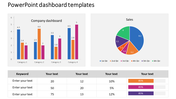
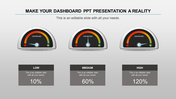
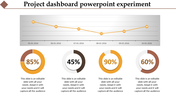
    Download Now! The Speedometer Chart PowerPoint Template is an excellent option for any business presentation. It is a useful way to create a performance dashboard. It can be used to illustrate a scenario and give the percentage completion. It is also a 100% editable slide. Its versatility and ease of use make it the perfect template for any project.


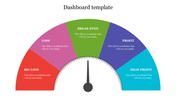
    The Speedometer Chart PowerPoint Template has a well-designed dashboard with three speedometers. It has three text holders to present your descriptions clearly and concisely. It helps to explain different metrics. The background will enhance the look and feel of your presentation. Its user-friendly interface is an excellent tool for business professionals. SlideEgg also offers your Free Speedometer Slide with great quality.


    Features of this template:

    1. 100% customizable slides and easy to download.

    2. Slides available in different nodes & colors.

    3. The slide contained 16:9 and 4:3 format.

    4. Easy to change the slide colors quickly.

    5. Well-crafted template with instant download facility.

    6. It has a creative dashboard with three speedometers.


    Advertisement

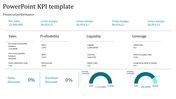
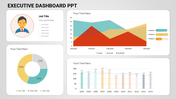
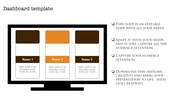
    You May Also Like These PowerPoint Templates

    Add to Wishlist
    Download
    AI Customize
    Internet speed dashboard featuring two routers with speed performance indicators and mobile phones.
    Add to Wishlist
    Download
    AI Customize
    Infographic charts for PowerPoint slide featuring bar, pie, and map charts in different styles and colors.
    Add to Wishlist
    Download
    AI Customize
    Executive dashboard slide with gender bar chart, line graph,pie chart, and area chart for executive data analysis.
    Add to Wishlist
    Download
    AI Customize
    Electricity dashboard showing a bar chart on the left and a line chart on the right, depicting electricity data.
    Add to Wishlist
    Download
    AI Customize
    Dashboard slide with three gauges displaying percentage levels, labeled low, middle, and high with placeholder text.
    Add to Wishlist
    Download
    AI Customize
    Dashboard overview slide displaying traffic, payment, server load, expenses, and product metrics using graphs and charts.
    Free
    Add to Wishlist
    Download
    AI Customize
    Bar graph comparing financial data with blue and purple theme, with a text box explaining a high level approach.
    Free
    Add to Wishlist
    Download
    AI Customize
    Six-layer bullseye diagram executive dashboard with annotations on each layer, arranged symmetrically around the circle.
    Free
    Add to Wishlist
    Download
    AI Customize
    Green radial gauge with a modern layout, surrounded by five labeled rectangular sections on a neutral background.
    Add to Wishlist
    Download
    AI Customize
    Colorful dashboard PPT slide with world map, pie charts, bar graphs, and metrics with placeholder text.
    Add to Wishlist
    Download
    AI Customize
    Use Dashboard PPT Template Slide Designs
    Free
    Add to Wishlist
    Download
    AI Customize
    Dashboard template with three colorful gauge icons in the center and text boxes in green, blue, and gold.
    Free
    Add to Wishlist
    Download
    AI Customize
    PowerPoint slide with a project dashboard showing two speedometers to represent project progress with captions.
    Add to Wishlist
    Download
    AI Customize
    KPI dashboard with bar graphs showing data trends over time and two green summary boxes.
    Free
    Add to Wishlist
    Download
    AI Customize
    Dashboard PPT template featuring a speedometer with labeled sections like Direction, Objectives, Data, Business, and Study.
    Add to Wishlist
    Download
    AI Customize
    Vehicle dashboard slide featuring a speedometer on the left and a detailed table on the right with its brands.
    Add to Wishlist
    Download
    AI Customize
    KPI template showing a bar chart with four cases, and two circular progress indicators in blue and orange showing percentage.